Invented by Sun; Yixin, Wu; Bowen, Li; Zehao, Zhou; Shengkang
Welcome! If you’ve ever wondered how computers help predict future trends—like sales, weather, or even the number of calls a business will get—this article is for you. Today, we’re breaking down a new patent application that introduces a smart way to make these predictions more accurate and easier to use. Let’s dive in to understand why this matters, how it works, and what makes it different from older methods.
Background and Market Context
Almost every business, big or small, relies on numbers that change over time. These numbers are called time-series data. Imagine keeping track of how many toys you sell each day, how many people call your help desk each month, or how much rain falls each week. These patterns are important because they help companies, governments, and even you, plan for the future.
But figuring out what will happen next is not simple. In the real world, these numbers can change because of holidays, weather, or one-time events like a big sale or a pandemic. Companies want to know what’s coming so they can make smart choices—like hiring more workers, ordering more stock, or staying ahead of the competition. Because of this, there’s a huge demand for tools that can predict time-series data. These tools are used in banking, healthcare, retail, logistics, and more.
The market is full of software trying to do this job. Some tools are made for experts, like data scientists, who know how to use complicated math and programming. Other tools try to be more user-friendly but often don’t give the results that businesses need. Most of these tools use one type of model to look at the numbers and guess what will happen next. But here’s the catch: no one model is perfect for every situation.
For example, a model that’s good at guessing what will happen in the next month might be bad at guessing a year from now. Some models work well when there’s a clear pattern, like sales going up every December, but struggle when things change suddenly. Also, most tools don’t let regular people—those who aren’t experts—build or adjust these prediction models easily.
The need for better, easier-to-use forecasting tools is growing. Companies want to use their data, not just collect it. They want tools that are fast, accurate, and open to everyone, not just a handful of technical experts. They also want to blend the strengths of different models, so their predictions are as smart as possible. This is where the new patent comes in. It aims to make forecasting more accurate, more transparent, and much easier to use.
Scientific Rationale and Prior Art
Before this patent, most forecasting tools used just one model at a time. There are many types of models used for this, including:
– ARIMA or SARIMAX models, which look for patterns that repeat over time and can include extra information.
– Exponential Smoothing models, which give more weight to recent data.
– Prophet models, which are good for business data that has repeating trends and sudden changes.
– Unobserved Components models, which break the numbers into pieces like “seasonal effects” or “trends.”
Each model type has its own way of guessing the future. Some are better at short-term predictions, while others are better for long-term forecasts. Some can handle sudden jumps or drops, while others need the data to be smooth and steady. Because of this, companies often find themselves switching between models or building many different ones for different tasks.
To tune these models, experts use techniques like “grid search.” This means they test lots of settings (called hyperparameters) to find the best combination for their data. It’s like trying every knob and button on a radio to get the clearest sound. This process is slow and can only be done by people with technical skills.
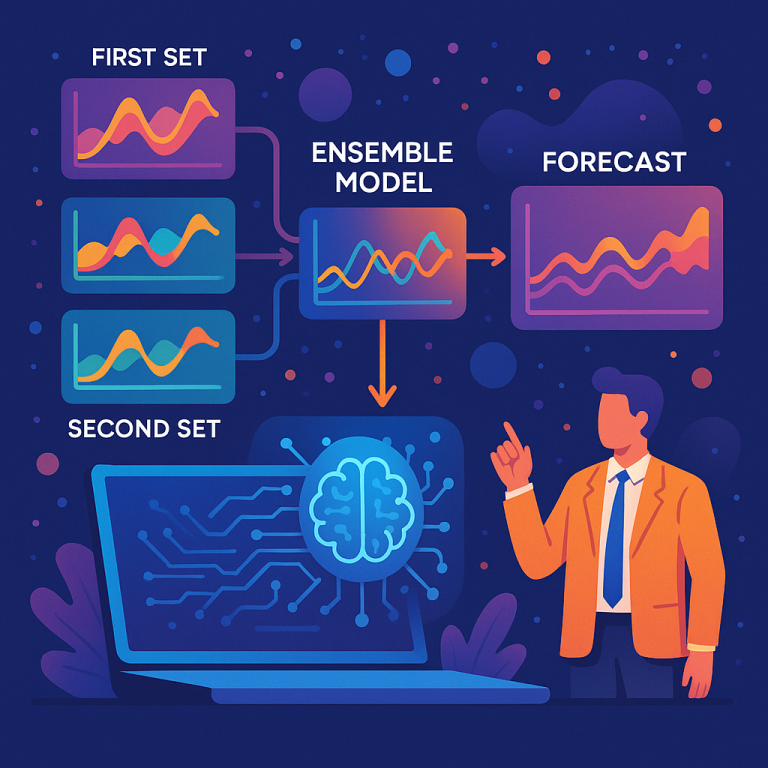
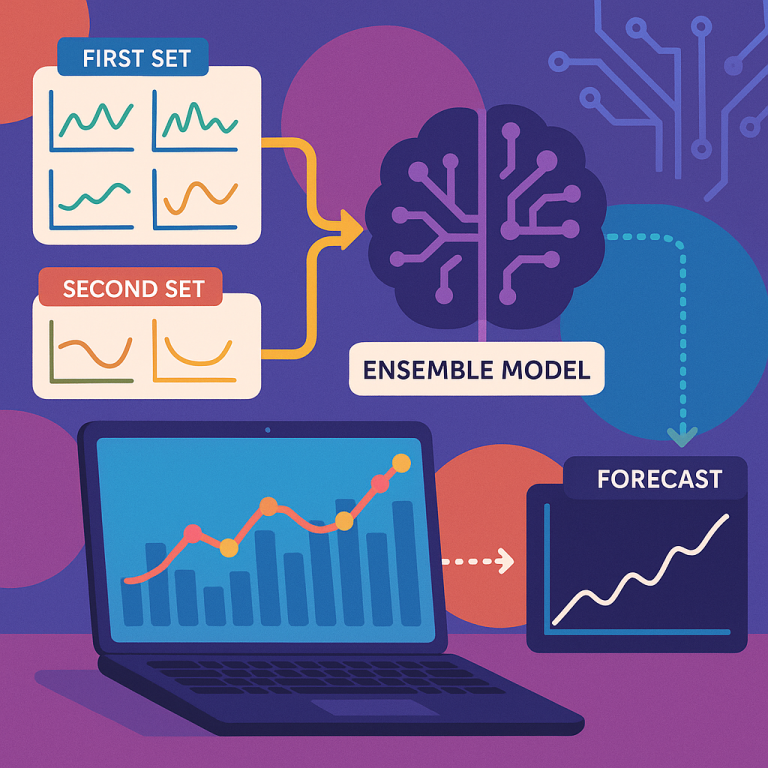
A few tools tried to combine the predictions from several models, creating what’s called an “ensemble.” In theory, this makes the forecast better because it balances the strengths and weaknesses of each model. But here’s the problem: these systems are usually hard to set up, require expert knowledge, and don’t let users adjust or blend models for different time frames (like short-term vs. long-term forecasts).
Another challenge is that real-world data is messy. Sometimes one-time events change the numbers (like a big storm or a new law), and most tools don’t make it easy to clean or adjust the data before building a model. Plus, existing tools keep the process hidden behind technical walls, so regular users can’t see how the forecasts are made or why they change.
In summary, older forecasting tools are limited because:
– They often use only one model type at a time.
– They’re hard for non-experts to use or adjust.
– They don’t blend models across different time frames.

– They don’t easily let users clean or normalize the data.
– They keep the process hidden and hard to explain.
The new patent takes a big step forward by solving these problems. It builds on the strengths of past models and tuning methods but makes the whole process open, easy, and flexible.
Invention Description and Key Innovations
The heart of this invention is a computing platform that lets users build, adjust, and use ensemble models for forecasting time-series data. Let’s break down the main ideas in plain language.
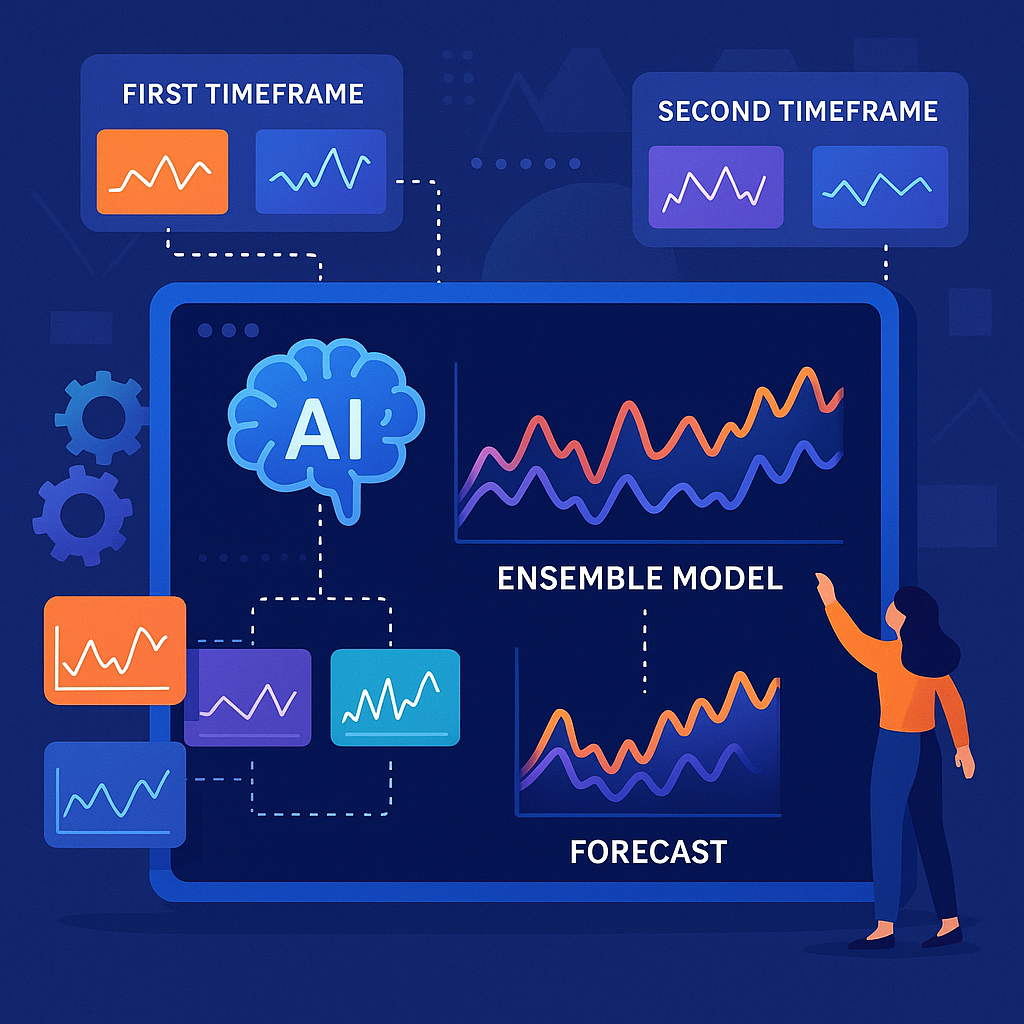
1. Multiple Model Sets for Different Time Frames
Instead of using just one model, the system builds several sets of models. Each set is tuned for a different time frame. For example, one set might be best at predicting the next six months, while another set is better for forecasts a year ahead. Each set includes more than one type of model, so their strengths balance out.
2. Smart Model Selection and Tuning
For every model type in each set, the system tests lots of settings (using grid search or similar methods) to find the best one. It looks at how well each model predicts real past data and picks the ones that perform best, using measures like “mean absolute percentage error” (MAPE). This makes sure that only the sharpest models are used.
3. User-Friendly Interface
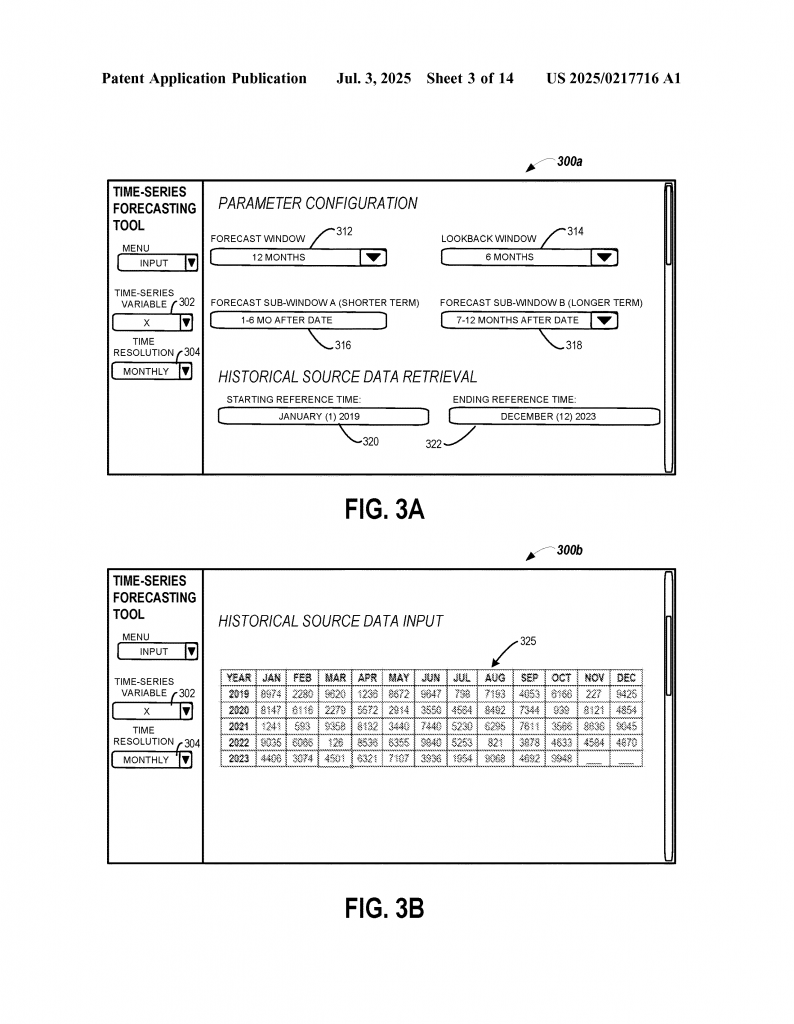
Here’s where it gets powerful: the system offers a clear, simple interface (GUI) that anyone can use. You don’t need to be a data scientist. The user can pick which models to include in the final ensemble, choose how much each model should influence the final prediction (by setting weights), and even blend models across different time frames. For example, you can set one group of models to handle short-term forecasts and another group for the long-term, then blend their results.
4. Easy Data Cleaning and Normalization
The system lets users clean up their data before building models. If something unusual happened in the past (like a pandemic), you can “back out” its effect so it doesn’t throw off your forecast. If there are influencing variables (things that might affect your numbers, like advertising spend or weather), you can add those in. This is all done through the same friendly interface.
5. Transparent and Explainable Forecasts
Because the process is open, users can see which models were used, what data went in, and why certain predictions were made. The system also helps users compare different versions of their forecasts and see what changed. Did the numbers go up because of a change in the data, or because a different model was chosen? The interface shows this clearly.
6. Scalability and Ease of Use
Unlike older tools that require building each model from scratch, this system reuses parts and makes it easy to create new forecasting setups. It can be run on cloud servers or in-house computers, and the software can be accessed from desktops, laptops, tablets, or even phones.
How Does It Work in Practice?
Let’s say you’re a business manager who wants to forecast next year’s sales. Here’s how you’d use this invention:
– You log in and see a clear dashboard.
– You pick your target variable (sales).
– You choose any influencing factors (like ad spend or season).
– You adjust for unusual past events (like a big one-time order).
– The system helps you build sets of models for short and long-term forecasts.
– You pick which models to include in your “ensemble” and set their weights.
– You run the forecast and get a clear, blended prediction.
– You can compare new results to past forecasts and see what changed and why.
If you want to adjust something, it’s as simple as changing your settings and re-running the forecast. No coding, no math degree needed.
What Makes This Invention Unique?
– It lets users blend models across different time frames, not just within one period.
– Non-experts can set up, adjust, and understand forecasts.
– Data cleaning and adjustment is built-in and easy.
– The interface is user-friendly and guides the user from start to finish.
– The whole process is transparent, so users know what’s behind each prediction.
– It’s scalable and flexible, so it works for small teams or big companies.
This patent is a game-changer for anyone who relies on time-series data. It brings together the best ideas in forecasting—smart models, tuning, and blending—and puts them in the hands of everyone, not just experts.
Conclusion
Accurate forecasting is vital in today’s data-driven world. This patent bridges the gap between complex forecasting models and real-world business needs. By blending different model types, allowing easy configuration, and offering a user-friendly interface, it empowers anyone to make smart, data-backed predictions. The ability to clean and adjust data, blend results across time frames, and see exactly how predictions are made sets this invention apart from anything that came before. Whether you’re a seasoned data scientist or a business leader with no technical background, this tool makes forecasting powerful, understandable, and accessible.
Click here https://ppubs.uspto.gov/pubwebapp/ and search 20250217716.