Invented by Smith; Barbara Sue, Sullivan; Daniel J., The Strategic Coach Inc.
In this article, we break down a new patent application that covers a smart way to figure out how likely someone is to reach a goal. This technology uses computers to collect information, compare it with targets, and give helpful feedback to users. Let’s dig into how this invention fits into the world, why it’s needed, and what makes it different from what came before.
Background and Market Context
In today’s world, we are surrounded by tools that track what we do. Fitness apps count our steps, smart watches check our sleep, and business software tracks sales and progress. But while these tools can tell us what happened, they often struggle to say how likely we are to reach our goals in the future. This is especially true when goals are complex, like saving enough for retirement, losing weight, or improving at work.
Most tracking systems focus on the present or the past. They show what you did today, or how far you are from your goal. But they rarely offer a clear, ongoing measure of how certain you are to reach that goal. For example, a runner might know how many miles they ran last week, but not how close they are to being ready for a marathon. A business might see last quarter’s numbers, but not how confident they should be about meeting their targets this year.
As a result, people and companies often make guesses about their chances of success. Sometimes these guesses are optimistic; other times, they are too cautious. Without a solid, data-driven way to measure certainty and uncertainty, it’s hard to plan, adjust, or make smart choices. This gap in the market is what the new invention addresses.
This technology steps in to give users—whether people, teams, or businesses—a straightforward number or “probability datum” that shows the likelihood of reaching a goal. It takes into account what has been done, what still needs to be done, and how things are changing over time. It also gives users a way to update their information and see how their probability changes, helping them stay on track and make better choices. This is useful not just for fitness or business, but for any area where reaching a goal is important.
The market for such technology is growing fast. Businesses want better forecasting tools. People want smarter health tracking. Schools want to help students see their progress. Anywhere there is a goal, there is a need for better certainty about reaching it. This invention finds its place right at the center of this growing demand, aiming to offer something more useful than a simple progress bar or a basic report.
Scientific Rationale and Prior Art
To understand why this invention is needed, let’s look at what has come before. Many current tools are based on tracking events or milestones. For example, fitness apps track steps, while business apps track sales or tasks completed. These systems can show progress, but they have trouble connecting that progress to the likelihood of hitting a specific goal. They often treat each day or event as isolated, rather than part of a bigger picture.
Some systems use simple calculations, like dividing what you have done by what you need to do. But these calculations do not capture trends, changes in behavior, or differences in how hard certain steps are. They rarely account for uncertainty—things that you don’t know or that might change the outcome. Also, most tracking systems require users to enter lots of data, which can be slow, hard, or boring, leading to incomplete or poor-quality information.
Other methods involve more advanced statistics or machine learning. For example, some business forecasting tools use past sales data to predict future results. Some health tools use machine learning to spot patterns in activity or sleep. However, these tools are often built for experts, are hard to use, or require lots of setup. They are not designed for everyday users or for real-time feedback.
In the world of artificial intelligence, there are also models that can classify data, group similar things together, or find patterns. But these models are usually hidden behind the scenes. They do not give users a clear, step-by-step way to see how their actions affect their probability of success. Nor do they let users easily update their information and see the results right away.
In summary, the prior art offers pieces of the puzzle, but not the whole solution. There are trackers, calculators, and predictors, but they do not bring together data from users and targets, classify the gap, and give clear, easy-to-understand feedback. They also do not offer a simple, interactive interface for users to update their information or see how changes affect their chances.
This is where the new invention stands apart. It uses smart data processing—like machine learning and fuzzy logic—to take in information from users, compare it to targets, figure out the gap, and turn that into a probability. It also gives users a way to interact with the system, add new data, and see how their probability changes. This makes the system much more useful, actionable, and user-friendly than what came before.
Invention Description and Key Innovations
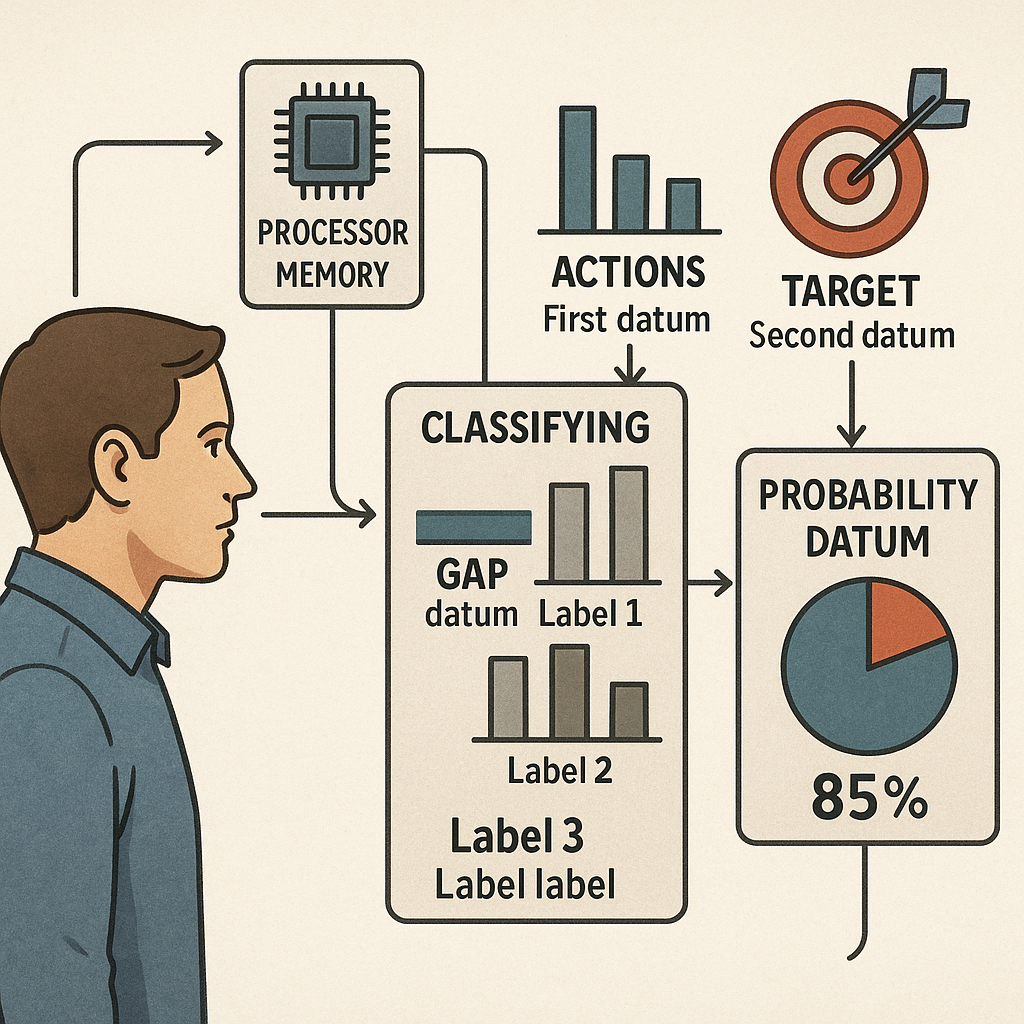
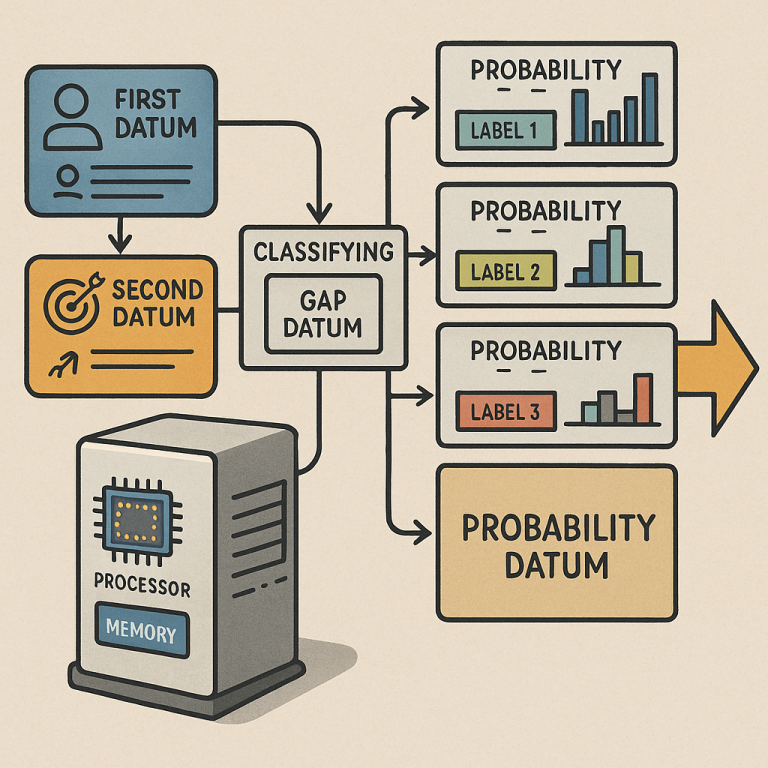
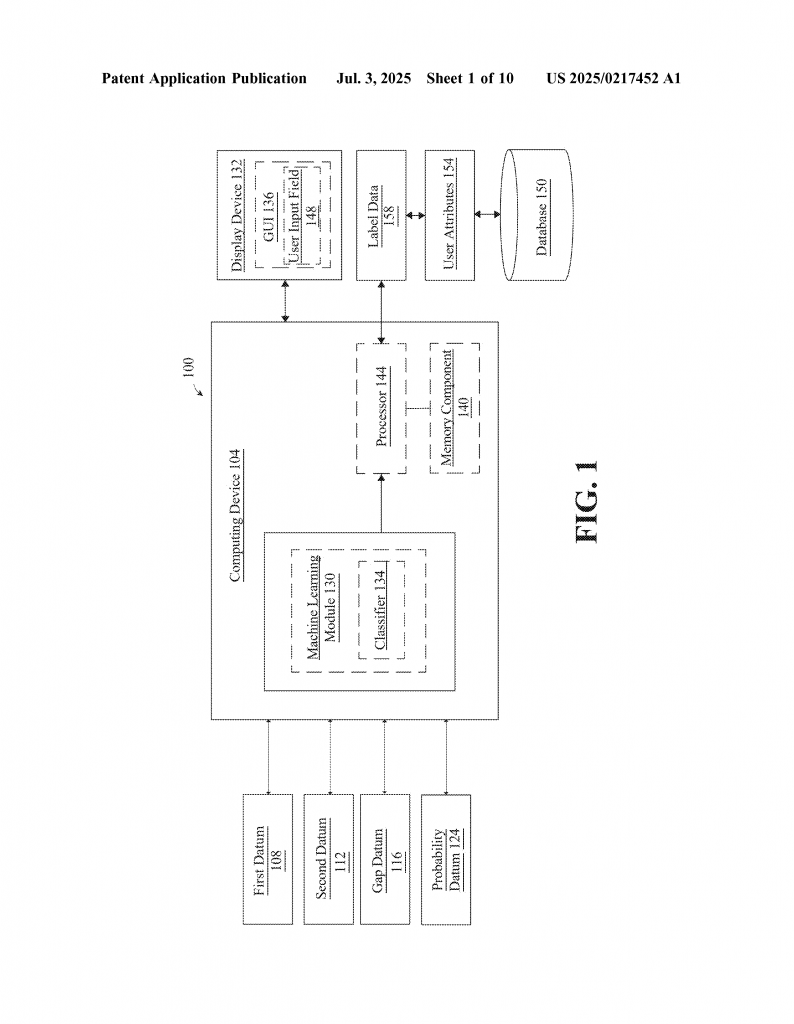
Now let’s look closely at how this invention works, and what makes it special. The core idea is simple but powerful: collect data about what a user has done (the “first datum”), compare that to a target or goal (the “second datum”), figure out the gap, and then use smart models to turn that gap into a clear probability number. The system also lets users interact with it, add new data, and see updated results.
Here’s how the invention puts this into action:
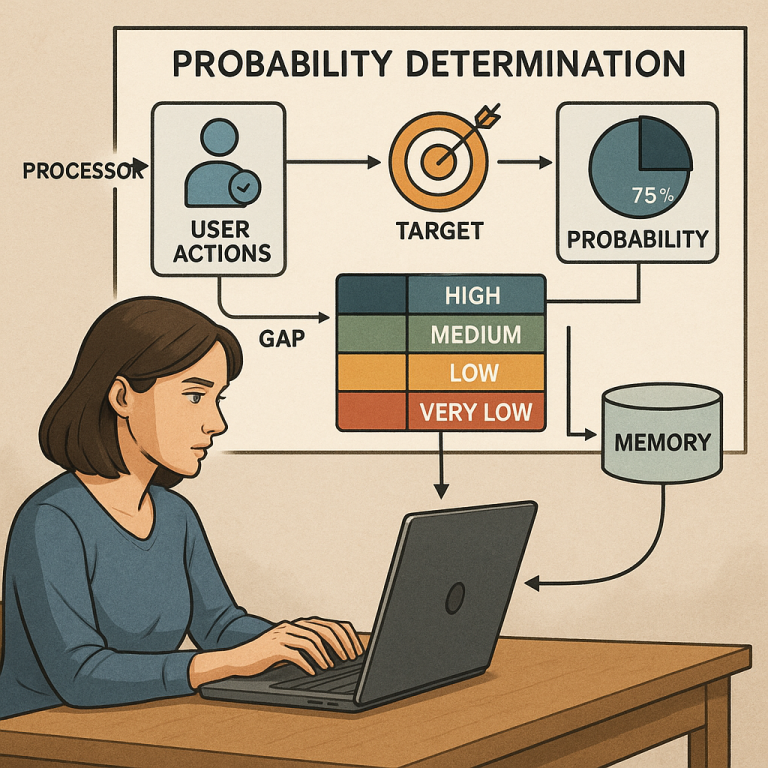
First, a processor (which could be part of a computer, phone, or server) gets the first datum from a user device. This could be information about actions taken, progress made, or steps completed. The processor also gets the second datum from a database. This is the target or goal—what the user is trying to reach. For example, it could be a sales target, a fitness goal, or a learning milestone.
Next, the system looks at both pieces of information and classifies them using “labels.” Each label has a value and represents things like certainty, uncertainty, importance, breakthrough, or advantage. The system figures out the “gap datum”—how far the user is from the goal—by comparing the first and second data. It then assigns a label to the user’s current state based on this gap.
The real magic happens when the system uses these labels to choose the right probability model. For example, if the gap is big and the user is far from the goal, the system might use a model that is more cautious. If the gap is small, it might use a model that is more optimistic. The system can pick from different models based on the label, which means it can adapt to different situations and users.
The result is a “probability datum”—a number that shows how likely it is that the user will reach the goal. This number can be updated as new data comes in, making it dynamic and responsive. The system can also group similar data points, find patterns, and learn over time, getting better as it goes.
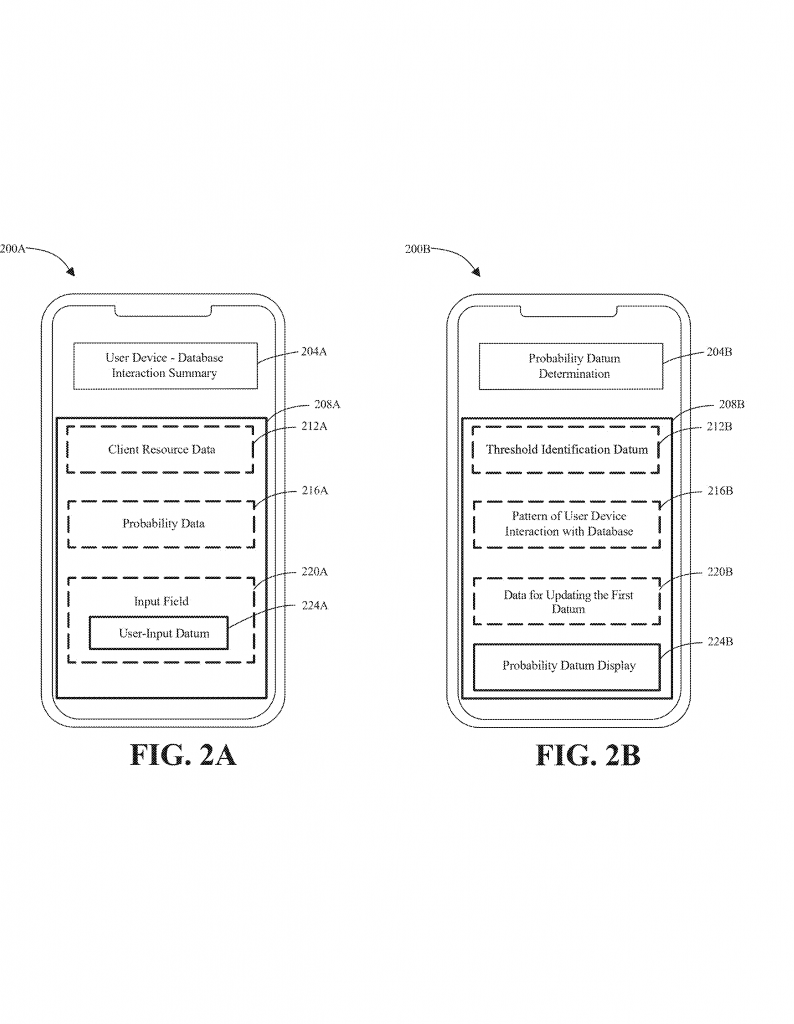
But the invention does not stop there. It also creates an “interface query data structure”—a special setup that tells a remote display device (like a phone or computer screen) how to show the data and get input from the user. This means users can see their probability, enter new information, and get instant feedback. The interface can be tailored based on user attributes, preferences, or device features, making it flexible and easy to use.
Some key innovations in this invention include:
– The use of both certainty and uncertainty indicators, allowing for a more complete and honest measure of progress.
– The ability to classify and label data based on the gap, making the feedback more meaningful and actionable.
– The use of different probability models for different situations, making the predictions smarter and more accurate.
– The interactive interface that lets users add new data, see updated probabilities, and get visual feedback, such as hierarchical or tree-structured displays.
– The system’s ability to learn from user input, group data, find patterns, and improve over time, thanks to built-in machine learning.
– The flexibility to work with many types of data, users, and goals, making it useful in business, health, education, and more.
For example, imagine a student using an app to track progress toward a reading goal. The system collects data on how many books the student has read (first datum), compares it to the goal (second datum), and figures out the gap. It then labels the student’s progress (such as “on track” or “needs improvement”), picks the right model, and gives a probability of hitting the goal by the deadline. The student can log new books at any time, see the updated probability, and get advice on what to do next.
Or consider a business team tracking sales. The system collects sales data, compares it to targets, and gives a live probability of meeting quarterly goals. The interface lets team members update their progress, see where the gaps are, and get tips based on past patterns. Over time, the system learns what works best and gives even better feedback.
The invention also uses smart ways to handle data, like fuzzy logic (which can deal with uncertainty and “gray areas”) and machine learning (which can spot patterns and get better over time). It can work with many different devices and databases, and it can scale up or down depending on the needs of the user or company.
Conclusion
This patent application introduces a new approach to tracking and predicting success. By combining user data and target data, classifying the gap, using smart models, and offering an interactive interface, the invention gives users a clear, honest, and actionable picture of their chances of reaching a goal. It fills a gap left by earlier tools and methods, making progress tracking more reliable, flexible, and user-friendly. In a world where everyone is looking to improve, make better choices, and reach their goals, this technology stands out as a practical and powerful solution.
If you are developing products in health, business, education, or any field where progress and certainty matter, this invention could change how you help users. It gives you a way to move beyond simple tracking, offering smarter, data-driven feedback that truly supports people on their journey to success.
Click here https://ppubs.uspto.gov/pubwebapp/ and search 20250217452.