Invented by Khansari; Mahdi, DISH Wireless L.L.C.
This article breaks down a new and important patent application focused on performance analysis in 5G wireless networks. If you work in telecom, IT, or network management, understanding this invention gives you a clear idea of where wireless technology is heading, and how you can use these ideas in your own work.
Background and Market Context
Wireless networks have changed a lot over the last decade. Today, 5G networks connect millions of devices and let people use more data than ever before. These networks are not just bigger versions of the old systems. They use new ideas and tools, such as cloud computing and virtual machines, which make them much more flexible. This flexibility also creates a new set of challenges for the people who have to keep them running smoothly.
In the past, a network was made of set pieces of hardware—boxes and wires in fixed places. Network engineers knew which piece did what, and when something broke, they could often find and fix it by hand. But 5G is different. Many network functions now run in the cloud. New parts of the network can be started up or shut down quickly, sometimes even automatically, in response to changes in demand. This means the network is always changing, and it is hard to keep up with all the new data coming in from different places.
One big problem in 5G networks is keeping track of what is happening. With so many moving parts, and so much data, it is easy for problems to go unnoticed until they affect many users. When issues do come up, it can be hard to know where to look or what to fix first. This is especially true for large networks that cover many cities, regions, or even countries. Each part of the network might have its own rules, goals, and teams. Traditional reports, which are the same for everyone, do not always help. What is important in one place might not matter in another.
The people who run these networks need better ways to see what is happening, spot trouble before it spreads, and make smart decisions about what to fix. They need tools that can quickly gather and sort through huge amounts of data, find the most important problems, and suggest what to do next. This is where the invention in this patent application comes in.
The patent describes a system that not only collects performance data from all over a 5G network but also uses smart methods to find which parts of the network are causing the most trouble. It lets users drill down into the details, see how problems move over time, and get tailored reports and recommendations. In short, it is a modern solution for a modern problem, built for the world of cloud-based, ever-changing networks.
Scientific Rationale and Prior Art
To understand why this invention is needed, we need to look at how networks have been managed in the past, and what has changed with 5G. Old networks were made of fixed hardware, each with its own place and purpose. Performance monitoring was simpler: you could check the health of each device, collect data on things like call drops or slow speeds, and write reports based on a handful of numbers.
As networks got bigger and more complicated, companies started to use more advanced systems for tracking performance. These systems often included dashboards, alerts, and simple ranking of problems. Some even let users set up their own rules for what counted as a problem. But these older systems had limits. They could not handle the huge amount of data produced by modern 5G networks. Also, they were not very good at showing how problems changed over time, or at helping teams work together across different parts of the network.
Another big change with 5G is the move to cloud computing. Now, most of the “brains” of the network live in virtual machines, which can be moved or copied quickly. This means the network can grow or shrink as needed. But it also means the network is always in flux. Traditional monitoring tools, which expected fixed devices, struggle to keep up. They cannot always track which virtual device is doing what, or how changes in one place affect another part of the network.
Some companies tried to fix this with machine learning—the use of computer programs that learn from data. There are systems that use machine learning to spot patterns, predict problems, or suggest fixes. But these systems are often separate from the main reporting tools, and it is hard to use their findings in day-to-day decisions. Also, different teams might use different tools, which leads to confusion and missed problems.
The “top offender” idea is not new; ranking the worst-performing parts of a network has been done before. But in the past, this was usually a simple list: “Here are the sites with the most dropped calls,” or “Here are the slowest connections.” This approach does not take into account how the network is structured, how problems change over time, or how fixing one problem might help others. It also does not provide much help in deciding what to do next.
The patent application improves on these old ideas in several ways. It brings together data from the whole network, both physical and logical. It uses a clear model of how the network is organized, so users can look at problems at any level—from a single cell tower to a whole region. It tracks how performance changes over time and gives special attention to issues that are getting worse. It also connects to machine learning models to suggest actions, and it can even carry out some actions on its own. This makes it a much more complete and helpful tool for network managers.
In summary, the invention builds on what has come before—simple rankings, dashboards, and even machine learning—but goes much further. It is designed for the realities of 5G networks: fast-changing, cloud-based, and full of data. It gives users the power to see, understand, and fix problems in a way that older tools cannot.
Invention Description and Key Innovations
The heart of the patent application is a performance analysis system. This system is made to work with 5G networks, but the ideas could also help with other types of networks. Let’s walk through how it works and what makes it special.
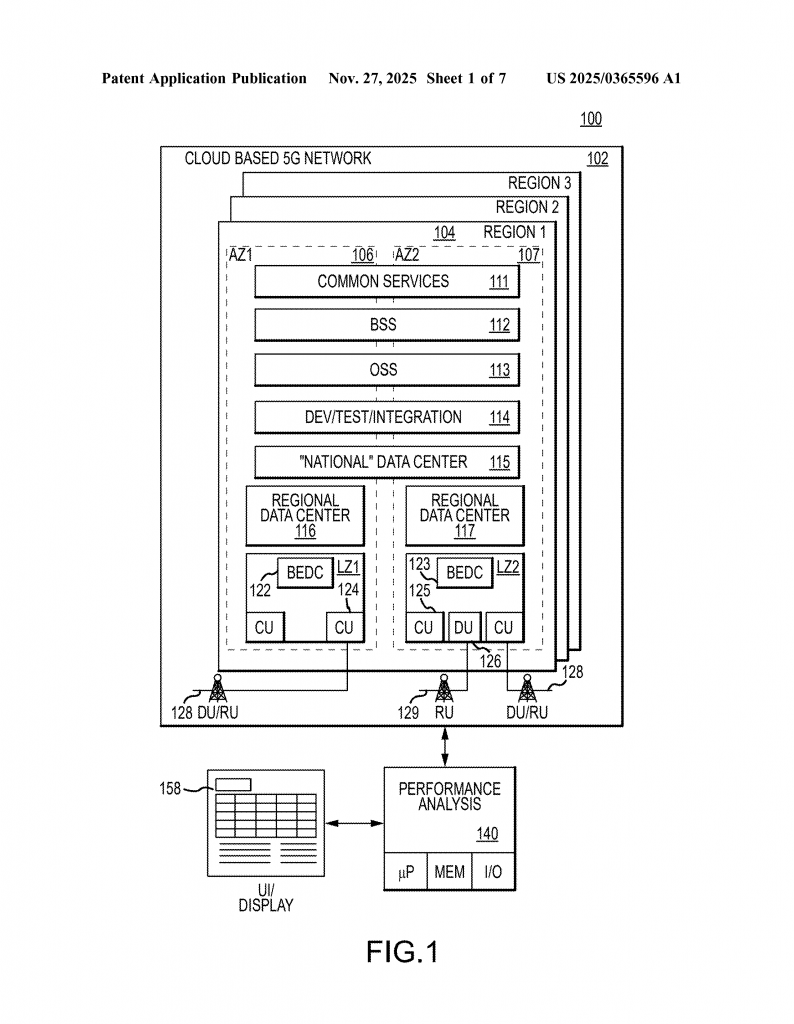
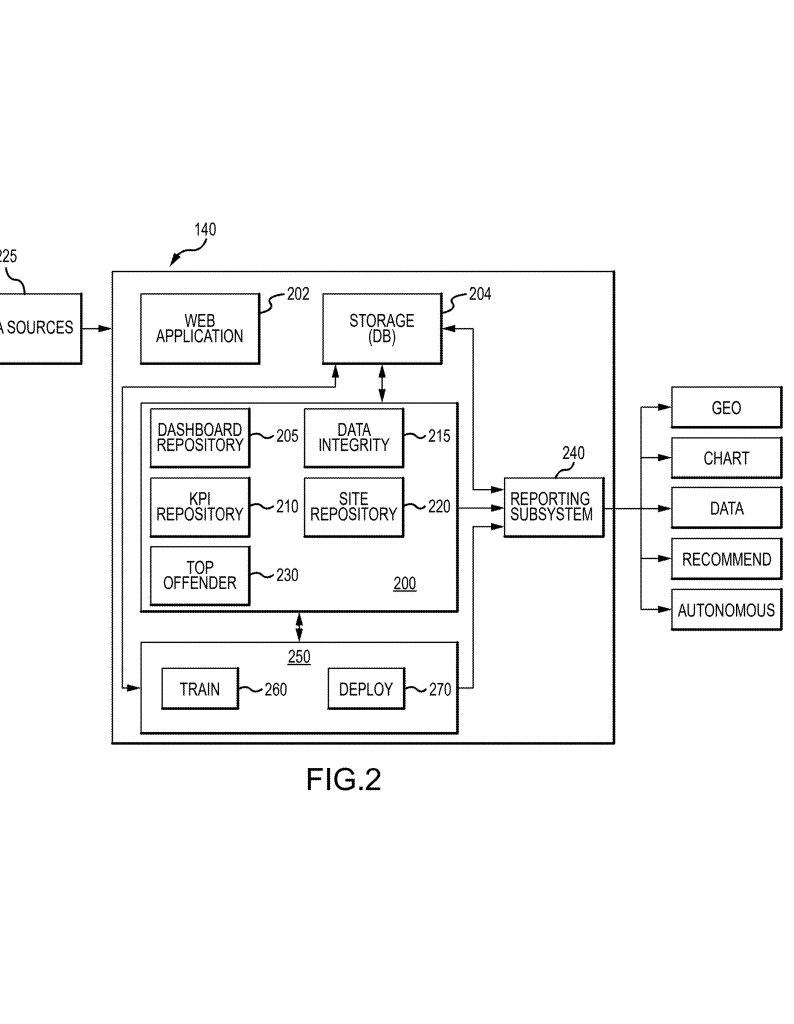
The system is built around a few main parts:
– A user interface lets people ask questions and see reports about the network. This could be a web page, an app, or an API that other programs use.
– A KPI subsystem collects data from the network. KPI stands for Key Performance Indicator—a number that tells you how well the network is working. The system can use many kinds of data: how many calls drop, how many users are connected, how much bandwidth is used, how quickly users can connect, and more.
– A site subsystem manages information about how the network is set up. This includes both the physical layout (where the towers and antennas are) and the logical layout (how the virtual machines and software pieces are arranged).
– A top offender subsystem is the part that finds trouble spots. It looks at all the KPI data and figures out which parts of the network are having the biggest negative effect.
– A reporting subsystem puts all this together and makes reports for users.
Here’s how the system works in practice:
1. A user (or another system) sends a request—for example, “Show me the cell sites with the most dropped calls in this city today.” The system can handle requests for any level of the network: a region, a market, a site, a sector, or even down to a single device.
2. The site subsystem checks its records to see which parts of the network fit the request. This helps make sure the data is correct and up to date. If there is missing or strange data, it gets flagged so it does not mess up the results.
3. The KPI subsystem pulls together the performance data for those network parts. It applies the right formulas to turn raw numbers into meaningful KPIs.
4. The top offender subsystem compares all the KPIs and ranks the network elements. But it does more than just make a list. It can look at how each KPI has changed over time (is it getting better or worse?), and how much each problem is affecting the whole network (is it a big deal or just a blip?). This lets users focus on the most serious issues—the ones that are new, getting worse, or have the biggest impact.
5. The system creates a report, which can include not just the rankings, but also extra details to help with troubleshooting. Users can see trends, compare sites, and drill down to find root causes.
6. Optionally, the system can connect to machine learning models. These models can look for patterns, suggest what to fix, and even carry out fixes automatically if the user wants. For example, if a certain type of problem keeps coming up, the model might suggest changing a setting across all affected sites, or it might spot a hidden pattern that points to a hardware failure.
7. The user interface shows all this in a way that is easy to understand—charts, maps, tables, or whatever the user prefers. If something needs immediate attention, the system can send alerts or notifications.
Some key innovations stand out:
– The system works with both the physical and logical layout of the network. This means it can see how virtual changes (like spinning up a new server) or physical changes (like adding an antenna) affect performance.
– It does not just list problems; it shows how they move over time and what impact they have. This helps users spot new issues before they get big, and understand which problems matter most.
– The data validation steps make sure that bad or missing data do not lead to wrong conclusions. This reduces wasted time chasing false alarms.
– The system is flexible. It can take requests from people, other programs, or even run on a schedule. Reports can be tailored for different teams, so each group gets what they need.
– By connecting to machine learning models, the system can keep getting smarter. As more data comes in, it can learn what kinds of problems are important, how to spot them faster, and what fixes work best.
Let’s take a simple example. Suppose a network operator wants to know which cell sites in a city are causing the most dropped calls. They use the user interface to make a request. The system checks its records to find all the cell sites in that city, gets the call drop data for each site, and ranks them. But it also shows which sites have seen their drop rate go up lately, and which ones are responsible for the biggest share of drops across the whole city. The operator can drill down to see if the problem is just at certain times of day, or if it matches up with other issues (like high traffic or bad weather). If the system is set up for it, it might suggest trying a fix—like changing a network setting or sending a technician to check the hardware.
Another example: suppose a machine learning model sees that every time a certain software update is rolled out to a type of virtual machine, dropped calls go up at some sites. The system can flag this pattern, suggest rolling back the update, and even automate the process if approved. This saves time and stops problems before they spread.
In both cases, the key is that the system is fast, flexible, and smart. It brings together data from many sources, makes sure it is clean and correct, and gives users the tools to focus on what matters.
Conclusion
This patent application describes a powerful new system for managing and improving 5G wireless networks. It addresses the real challenges faced by network operators today—huge amounts of data, fast-changing setups, and the need to spot and fix problems quickly. By using a flexible structure, smart data validation, and connections to machine learning, it lets users see exactly what is happening in their networks, find the real trouble spots, and take action. For anyone working in telecom or network management, these ideas could change the way you look at network health and performance. As 5G and future networks continue to grow, tools like this will be key to keeping them running smoothly, efficiently, and reliably.
Click here https://ppubs.uspto.gov/pubwebapp/ and search 20250365596.