Invented by Khansari; Mahdi, DISH Wireless L.L.C.
Understanding how wireless networks work is not easy, especially with the fast changes happening in 5G technology. The patent application we’re unpacking today introduces a system designed to make sense of the immense and ever-shifting data from modern 5G networks. This new system doesn’t just collect data; it helps people see problems, figure out what’s wrong, and even offers fixes—sometimes all by itself. Here, we’ll walk through why this matters, how it builds on what came before, and what makes this invention stand out.
Background and Market Context
Let’s start with where the world is right now when it comes to wireless networks. If you look at your phone, your smart home, or even cars on the road, you’ll see that almost everything needs a solid connection. We used to rely on older networks built with specific pieces of hardware, each doing a single job. Today, with 5G, things have changed. The network is not just faster; it’s more complex, flexible, and can do much more.
5G networks are rolling out everywhere, and they’re expected to connect billions of devices. These networks aren’t just for making calls or browsing the web—they’re the backbone for smart cities, factory robots, delivery drones, and so much more. That means people expect these networks to work all the time, everywhere. If a part of the network fails, it’s not just an inconvenience—it can stop work or even put people at risk in critical services.
But here’s the real challenge: unlike the old networks, 5G is made up of both physical parts (like antennas and radios on towers) and virtual parts (software running in the cloud). The physical parts still need regular maintenance and careful setup, but the virtual parts can change at lightning speed. Need more capacity in a certain city? You can spin up new software in the cloud in minutes. If demand drops, you can turn it off just as quickly. This flexibility is great, but it also means the network is always changing—making it much harder to keep track of what’s happening, let alone spot problems before they cause trouble.
Operators, who run these networks, have to deal with floods of information coming in from thousands of different points—towers, servers, user devices, and more. And this data is not all the same. Some of it is about how the network is set up (called “static data”), and some is about how things are working right now (called “performance data”). There are also different teams—each with their own goals and ways of working—trying to use this data to keep the network running smoothly. This makes it tough to quickly spot problems, understand where they’re coming from, and fix them before users notice.
On top of that, networks need to meet strict “uptime” goals. Any downtime can mean lost money, unhappy customers, or even safety risks. So, there’s a growing need for tools that can help operators not only see what’s happening across their networks in real time, but also help them dig deep, spot trends, and recommend fixes—sometimes even making changes automatically to prevent problems from growing.
The market for these kinds of smart network management tools is huge. As networks keep getting bigger and more complex, the old methods—manual checks, spreadsheets, and one-size-fits-all reports—just aren’t good enough. Operators need systems that can handle the data flood, adapt to change, and help them make smart decisions, fast.
Scientific Rationale and Prior Art
Why is this new system needed? To answer that, let’s look at how things have been done until now.
In the early days of wireless networks, everything was connected through fixed hardware. If something broke, you could usually find the problem by checking the equipment. Data about the network was often collected manually, and reports were built by hand. These methods worked because the networks were smaller, with fewer moving parts.
As networks grew and started using more software, especially with 4G and now 5G, things changed fast. Now, a single network can have thousands of cell sites, each with its own setup and performance data. The hardware is still there, but many parts—the brains of the network—run in the cloud. Operators started using industry standards like Open RAN (O-RAN) to help different parts work together, but this added another layer of complexity. You could add or remove virtual network parts quickly, but this also meant the network’s “shape” could change all the time.
Existing solutions tried to keep up by collecting more data, automating some checks, and building dashboards. But these systems often struggled with keeping data clean and up to date. Data could be missing, wrong, or in the wrong format. Different teams used different tools, and there was no easy way to pull everything together into one clear picture. Reports could be out of date the minute they were made. Worse, it was hard to see not just what was happening, but why—and even harder to find out what to do next.
Some systems started using machine learning (ML) to spot patterns or predict problems, but these were often “add-ons” rather than fully built into the flow of the network’s day-to-day management. They might just send alerts, leaving it up to humans to figure out what to do. There were also dashboards, but most were not flexible enough to let different teams get the kind of custom reports they needed, or to drill down into specific sites or issues.
Another big gap was in data validation. With so many sources and formats, errors could creep in—making reports unreliable. Many tools did not have strong ways to filter out bad data before it was used. And while some could summarize performance, they couldn’t always link it back to the physical and logical structure of the network—making it hard to know which specific cell or part was causing trouble.
Finally, existing systems were often not proactive. They might tell you something is wrong, but they didn’t give recommendations or take action to fix it. True, some “self-healing” networks exist, but they usually work in narrow ways, not across the full range of data and situations.
So, to sum up, the big pain points in prior art were:
– Struggling to keep up with the flood of mixed data from a huge, shifting network
– Data errors and mismatches across sources
– Lack of flexible, real-time, and customized reporting
– Weak links between performance data and the actual physical/logical layout of the network
– Limited use of ML or AI to not just spot problems but also suggest and carry out fixes
The patent application we’re discussing addresses all these gaps with a new, integrated system that brings together data collection, validation, performance analysis, and automated action in a single, flexible platform.
Invention Description and Key Innovations
Now, let’s get into the heart of the invention and see what really makes it special.
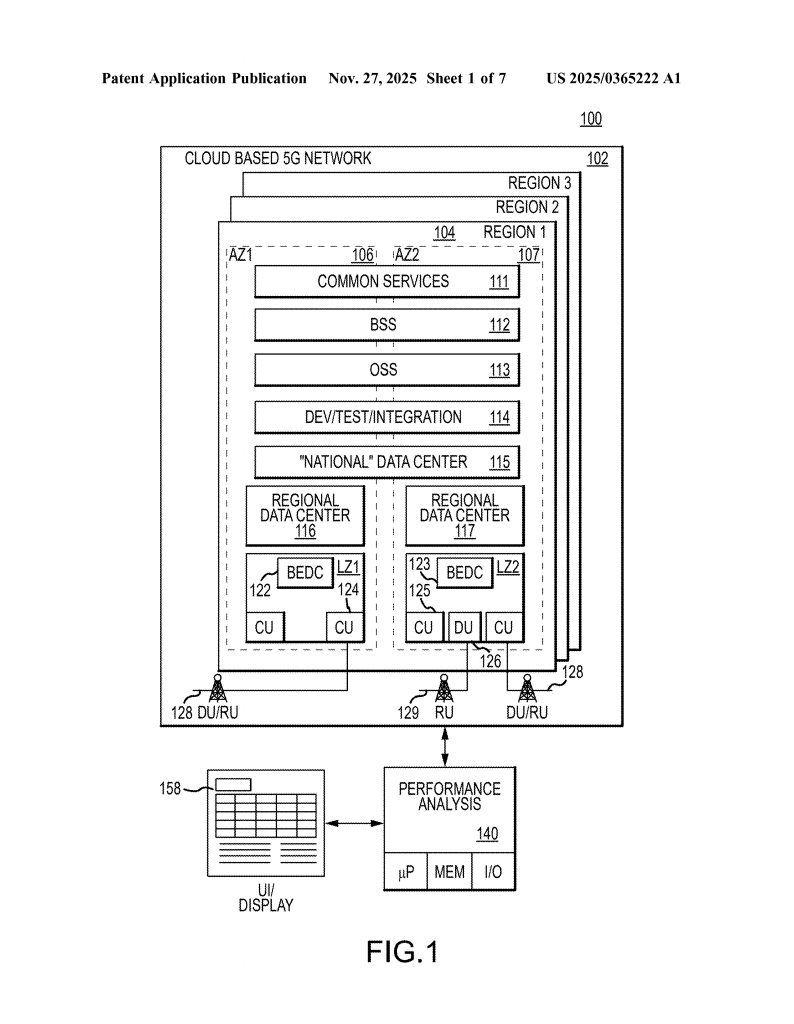
This new system is called a “performance analysis system.” It’s designed to work with a wireless network that has many cell sites. The system has several key parts, all working together to collect, clean, analyze, and report on network data—while also giving users the power to ask for the exact information they need and, in some cases, letting the system take action on its own.
User Interface and Data Requests
It all starts with a user interface. This could be a web page, an app, or a dashboard. Operators or automated systems can ask for network performance reports using this interface. The request can be very specific: for example, “Give me a report on dropped calls in this city during the past hour,” or “Show me which cell sites had the worst outages last week.”
Data Management Subsystem
The next big piece is the data management subsystem. This is the brain that goes out to one or more network data sources and pulls in two types of data:
– Static data (how the network is set up—cell site locations, hardware details, configuration)
– Performance data (how the network is working right now—such as signal strength, dropped calls, throughput)
To make sense of all this, the system has a site subsystem that checks and organizes the static data. It uses hierarchy models (think of these as maps of how the network is organized, both physically and logically) to validate the data. If the static data doesn’t match what’s expected—say, a cell site is missing or mislabeled—it can flag or fix the problem.
Another key part is the Key Performance Indicator (KPI) subsystem. This part takes the performance data and applies special formulas to turn raw numbers into meaningful measures—like “call drop rate,” “network latency,” or “average user data speed.” These formulas can be pulled from a central library, and the system can pick the right ones based on the user’s request.
Reporting and Dashboards
Once the data is validated and the KPIs are calculated, the reporting subsystem steps in. It puts the results together into clear, focused reports. These reports can be shown right away, saved for later, or even sent as alerts. They can be tailored to different needs—maybe a simple summary for executives, or a deep dive for engineers.
There’s also a dashboard subsystem that builds and stores visual dashboards. These can show trends over time, highlight problem areas, or let users drill down into specific sites or metrics. Dashboards can be set up in advance or created on the fly based on user requests.
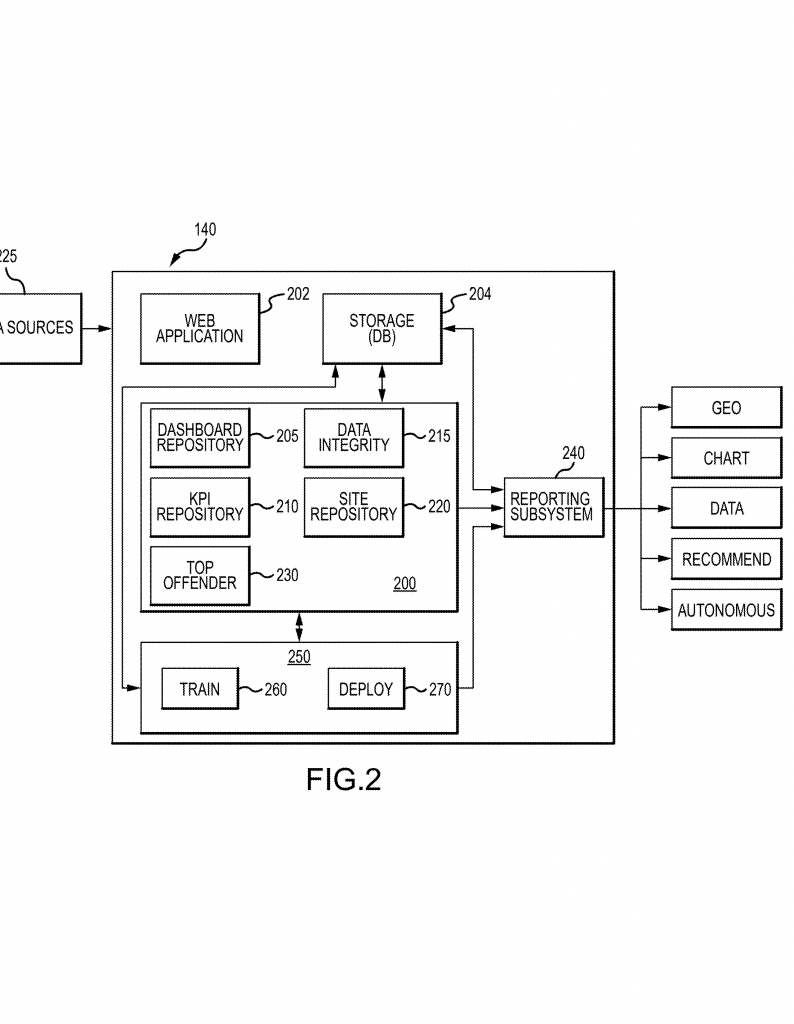
Machine Learning and Automated Action
One of the most exciting parts of this system is its use of machine learning. There’s a dedicated machine learning model (MLM) subsystem that takes both the validated static data and the KPI data, and runs them through smart models. These models can spot patterns and recommend actions—like adjusting network parameters, redistributing traffic, or highlighting sites that need maintenance. In some cases, the system can even carry out these fixes automatically—without waiting for a human to step in.
The MLM subsystem can choose the right model from a catalog, depending on the need. For example, one model might be best at catching “sleepy cells” (sites that are working but underperforming), while another could predict upcoming outages. The system can constantly retrain these models as more data comes in, getting smarter over time.
Data Integrity and Error Handling
Bad data can lead to bad decisions. That’s why the system includes a data integrity subsystem that checks all incoming data for errors. If it finds something wrong—like missing values, out-of-range numbers, or mismatched sources—it can block that data from being used in reports or actions. This keeps the system’s recommendations reliable and trustworthy.
Top Offender Analysis
Another standout feature is the top offender subsystem. This part looks at the network and identifies which elements—like specific cell sites or clusters—are causing the most trouble. It can rank them, show how their performance is changing over time, and highlight which ones are having the biggest impact on overall network quality. This makes it much easier for operators to focus their efforts where they matter most.
How It All Comes Together
Let’s walk through a typical use case:
1. An operator logs into the system and asks for a performance report on a specific region’s cell sites, looking at dropped calls over the past week.
2. The system collects the latest static and performance data from across the network.
3. The site subsystem checks the static data, making sure all details are correct and up to date.
4. The KPI subsystem calculates the right metrics, using formulas tailored to the operator’s needs.
5. The data integrity subsystem checks for errors, removing any bad data from the mix.
6. The reporting subsystem builds a focused report, showing which sites had the most dropped calls, how things changed day by day, and which sites are getting worse or better.
7. The top offender subsystem highlights the worst-performing sites, while the dashboard subsystem presents everything in easy-to-understand graphs.
8. The MLM subsystem analyzes the trends and suggests specific actions—maybe adjusting power levels on certain antennas, or scheduling maintenance at a troubled site.
9. If allowed, the system can even make these changes automatically, or send alerts to the right team.
All of this happens quickly, often in real time or near real time. The system stores past reports and dashboards, so operators can go back and see how things have changed. And because it’s built to be flexible, different teams can get exactly the data and insights they need, formatted just the way they want.
Key Innovations and Advantages
What sets this invention apart from what came before?
First, it’s integrated. All the key functions—data collection, validation, analysis, reporting, and action—are built into a single platform. This means less time wasted switching between tools, and a much clearer view of the network.
Second, it’s flexible. The system handles both physical and virtual parts of the network, understands how they’re organized, and lets users ask for highly specific reports. It adapts to changes in the network’s shape, size, and setup.
Third, it’s proactive. The use of machine learning is not just for alerts, but for real recommendations and—if desired—automatic fixes. This can save time, reduce outages, and improve the network’s reliability for everyone.
Fourth, it’s reliable. Strong data integrity checks mean that reports and actions are based on clean, trusted data. This builds confidence in the system and helps operators make better decisions.
Finally, it’s actionable. By highlighting top offenders, showing trends, and recommending specific steps, the system empowers operators to focus their efforts where they’ll have the most impact.
In the fast-moving world of 5G and beyond, having a system that can keep up with change, make sense of complex data, and turn insights into action is a real game changer.
Conclusion
This patent application lays out a new approach to managing and improving wireless networks—one that brings together deep data analysis, smart automation, and flexible reporting in a single, powerful platform. By making it easier to see what’s happening, spot problems, and fix them (sometimes before users even notice), this invention offers a clear path to more reliable, efficient, and high-performing networks. As 5G keeps spreading and networks grow ever more complex, tools like this will be essential for keeping everything running smoothly. For operators, engineers, and anyone who relies on wireless connectivity, that’s very good news indeed.
Click here https://ppubs.uspto.gov/pubwebapp/ and search 20250365222.