Invented by Kim; Sung Jin, Teradata US, Inc.


Modern databases are always evolving. As more businesses move their data to the cloud and store it in new ways, the way databases search and find information must change too. In this article, we’ll break down a new patent application that tackles how databases can better estimate the cost of a query when data is stored as objects in the cloud. We’ll keep things clear and simple so you can understand why this matters, how it works, and what makes it different from the old ways.
Background and Market Context
Today, companies use databases to keep track of everything from sales to customer details. But databases don’t always work the same way. In the past, most databases stored data in neat blocks or rows on a company’s own hard drives. Now, more and more data is stored “in the cloud” using services like Amazon S3, Microsoft Azure, Google Cloud, and others. In these setups, data is saved in “objects” rather than rows or blocks.
This shift has brought new challenges. Accessing objects in cloud storage is slower and costs more money than reading from a local hard drive. That’s why companies want to make sure each database search, or “query,” is as fast and cheap as possible. But to do this, the database needs to estimate ahead of time how much work a query will take. This is called query optimization.
Query optimization is a bit like planning the best route for a delivery truck. The database tries to figure out which path will get the answer fastest and for the lowest cost. It does this by creating “query execution plans”—step-by-step instructions for how to find the needed data. The database picks the plan with the lowest cost.
But here’s the catch: in cloud object storage, it’s not enough just to know how many rows match a query. The database also needs to know how many objects it has to open and look inside. If it guesses wrong, it might choose a plan that takes a lot longer or costs much more.
This is where the new patent comes in. The inventors realized that modern object storage needs new ways to estimate how many objects a query will touch. Their approach helps the database make smarter guesses—saving time and money for companies using cloud-based data warehouses and analytics platforms.
In short, as data moves to the cloud and gets stored as objects, the way databases plan queries must also change. Accurate cost estimates are now critical, not just for speed but for controlling cloud costs. The technology in this patent creates new ways to make those estimates, keeping databases fast and efficient even as the storage methods change.
Scientific Rationale and Prior Art

To understand what’s new, let’s look at how things used to work and why that’s not enough anymore. In classic databases, all the data for a table was stored together. The system could easily count how many rows matched a search. If you wanted to know how many sales were made last month, the database could quickly estimate the number of rows and plan the best way to find them.
Older cost-based optimizers used statistics like the total number of rows, the number of unique values in a column, and maybe some histograms showing how data was spread out. These stats were usually kept in a “data dictionary.” When a user submitted a query, the optimizer would look at these stats, guess how many rows would match, and pick the fastest plan.
But as data moved into object stores in the cloud, these old tricks started to break down. That’s because, in object storage, data is split across many “objects.” Each object is kind of like a storage box—it might hold a bunch of rows from a table, but you don’t know which ones until you open the box.
What’s more, opening an object in the cloud takes longer and costs more than reading a row from a local disk. Every time you open an object, you might have to wait, and you might be charged by the cloud provider. So, the database now needs to estimate not just how many rows match a search, but how many objects it needs to read.
Some newer systems started to store extra stats about each object. For example, they might keep the smallest and largest value for each column in every object. This helps the system quickly skip objects that couldn’t possibly match a search. For example, if you’re looking for sales from January, any object whose date range doesn’t cover January can be skipped.
But even with these improvements, there were still problems. In big tables, there might be thousands or millions of objects. Reading the stats for each one takes too long. Plus, objects often don’t line up perfectly—the data inside each object can vary a lot. Some objects might have wide value ranges, others might be narrow. Sometimes, lots of objects are packed into the same range of values, and other times they’re spread out thin.
Existing methods often assumed objects were spread out evenly and all had about the same range. But this isn’t true in practice. This led to big errors—sometimes the system would guess too few objects, sometimes too many. As a result, the database might pick a query plan that was much slower or costlier than necessary.
What was needed was a better way to estimate, using just a small set of global stats (like total number of objects and the min/max values for each column), or with limited extra info like “object range histograms.” The solution had to be fast (so it didn’t slow down planning) and accurate (so it could pick the best plan).
The patent in question builds on these ideas. It introduces new ways to keep global stats, new ways to group objects by range, and new ways to build and use histograms for objects. All this is designed to help the optimizer quickly and accurately estimate how many objects a query will touch—leading to better, cheaper, faster queries in modern cloud databases.


Invention Description and Key Innovations
Let’s dig into what’s actually new and clever about this invention. The patent describes a system and method for estimating how many objects a query will touch in a cloud database. This lets the optimizer compare different query plans and pick the best one.
The invention includes three main estimation techniques, and introduces new types of global statistics to make these techniques work. Here’s how the system operates:
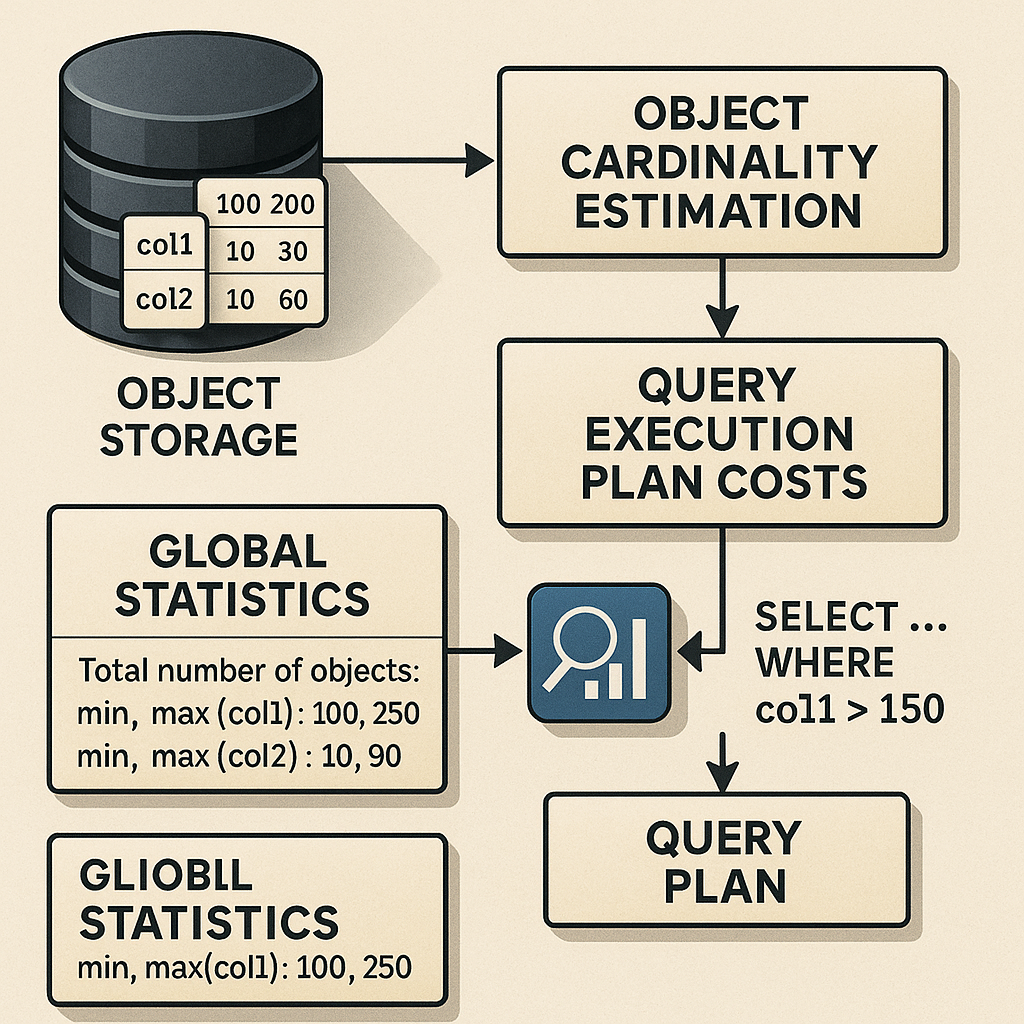
First, the database keeps a set of “global statistics.” These include things like:
- The total number of objects in storage
- The minimum and maximum values for each column, for every object
- The sum of the ranges (widths) for each column, across all objects
- Optionally, the sum of squared ranges, for measuring spread
When a user sends a query, the database builds one or more query execution plans. For each plan, it needs to estimate the “cost”—how many objects will need to be opened, and how much work must be done. To do this, it uses one of three methods:
1. General Estimation
In this simplest approach, the system assumes all objects are about the same width (that is, their value ranges are similar and evenly spread). It uses the global stats to see how the query’s search range overlaps with the global min/max, and then uses a formula to guess what fraction of objects will overlap the search.
For example, if you have 100 objects and your search covers about 10% of the total value range, it will estimate that 10 objects will need to be checked.

The formula takes into account whether the data is discrete (like whole numbers) or continuous (like weights or prices). It also looks at the average range width for each object. This keeps things fast and simple, and works well if the objects are pretty similar.
2. Stratified Estimation
This approach is for when objects are not all the same. Maybe some objects cover a very wide range, others are very narrow. The system groups objects into “strata” based on their widths. For each group, it uses the general estimation formula, but with the group’s own average width.
It figures out how many objects are in each group, based on the spread (standard deviation) of object widths. The results from each group are then added up for a final estimate.
This method is more accurate when objects are very different from each other. It does require tracking a bit more info—the sum of squared widths—but this can be kept up to date with each data change.
3. Object-Range-Histogram-Based Estimation
The third, and most advanced, method uses “object range histograms.” Here, the global value range is split into intervals. For each interval, the system tracks how many objects cover that interval, and how wide their ranges are.
When a query comes in, the system figures out which intervals overlap with the query’s range. It combines the info from those intervals to estimate how many objects will need to be checked.
To keep the histograms accurate and efficient, the system can merge, split, or remove intervals as data changes. If lots of new objects are added in a certain range, the system might split that interval for better detail. If objects are deleted, it might merge intervals to save space.
This method is especially good when objects are not evenly spread out. If most objects are packed into a small part of the value range, the histogram will show this, and the estimate will be much more accurate than just guessing based on averages.
Putting It All Together
With these estimation methods, the optimizer can quickly and accurately figure out the “object cardinality” for any query. Once it knows how many objects each plan will touch, it can estimate how long each plan will take and how much it will cost (in money and resources).
The optimizer can then compare different plans—maybe one plan scans everything, another uses an index, another does a parallel join—and pick the one with the lowest cost.
All of this happens automatically and behind the scenes, using only global statistics or compact histograms. There’s no need to scan through all the object stats every time, which would be too slow.
This invention also allows the system to scale. When there are thousands or millions of objects, the optimizer’s work doesn’t get slower or less accurate. As a result, databases can stay fast and efficient as they grow, and companies can keep their cloud costs under control.
The patent describes in detail how the stats are kept up to date, how histograms are built and adjusted, and how each estimation formula works for different data types. It also shows how the system can work with parallel processing, where different parts of the data are handled by different compute nodes. Each node can build its own histogram, and the results are combined for the final estimate.
At its core, this invention is about giving databases the tools they need to stay smart and fast as data storage changes. It’s a simple idea—make better guesses about what a query will cost—but the methods are clever, scalable, and practical for the real world.
Conclusion
As more data moves into the cloud and is stored as objects, old ways of estimating query costs just don’t cut it anymore. Databases need new methods that are fast, accurate, and work at scale. The patent we explored here delivers exactly that, through new statistics and smarter estimation techniques.
By tracking global min/max values, sums of object range widths, and optionally building object range histograms, the system can quickly estimate how many objects a query must access. This lets the optimizer pick the best plan, keeping queries fast and costs low.
With these innovations, cloud databases can handle huge amounts of data without slowing down or blowing up costs. It’s a smart, simple step forward for anyone who relies on cloud data warehouses and analytics. As businesses keep growing their data in the cloud, tools like these will be the key to keeping things running smoothly.
Click here https://ppubs.uspto.gov/pubwebapp/ and search 20250217360.