Invented by Agenta Breitenstein, Stanley Huang, Donald Pettini, Paul Bleicher, Ryan Scharer, Hua Ye, Humedica Inc
In today’s data-driven world, healthcare organizations are inundated with vast amounts of data from various sources such as electronic health records (EHRs), medical devices, wearables, and patient-generated data. However, the challenge lies in effectively harnessing this data and transforming it into actionable insights. Real-time data ingestion systems and methods play a crucial role in this process by enabling the seamless collection, integration, and analysis of data from multiple sources in real-time.
One of the key benefits of real-time data ingestion is the ability to monitor patient health and operational metrics in real-time. For example, a clinical analytics platform can ingest data from EHRs, medical devices, and other sources to generate a heat map that visualizes patient vital signs, such as heart rate, blood pressure, and temperature, in real-time. This allows healthcare professionals to quickly identify patients who may be at risk of deterioration and take proactive measures to prevent adverse events.
Furthermore, real-time data ingestion enables healthcare organizations to identify trends and patterns that may not be apparent when analyzing data retrospectively. For instance, by ingesting data from multiple sources, a clinical analytics platform can generate a heat map that highlights areas with high rates of hospital-acquired infections. This information can help healthcare organizations implement targeted interventions to reduce the spread of infections and improve patient safety.
The market for systems and methods for real-time data ingestion to a clinical analytics platform is driven by several factors. Firstly, the increasing adoption of EHRs and other digital health technologies has resulted in a significant increase in the volume and variety of healthcare data. Healthcare organizations are now looking for ways to leverage this data to improve patient care and operational efficiency.
Secondly, the growing emphasis on value-based care and population health management has created a need for real-time analytics capabilities. Heat maps generated by clinical analytics platforms provide healthcare organizations with valuable insights into population health trends, enabling them to identify high-risk patients, allocate resources efficiently, and implement preventive measures.
Additionally, the advancements in cloud computing and big data technologies have made real-time data ingestion more accessible and cost-effective. Cloud-based clinical analytics platforms offer scalability, flexibility, and real-time processing capabilities, allowing healthcare organizations to ingest and analyze large volumes of data in real-time without significant infrastructure investments.
In conclusion, the market for systems and methods for real-time data ingestion to a clinical analytics platform to generate a heat map is witnessing significant growth as healthcare organizations recognize the value of leveraging data to improve patient outcomes and operational efficiency. Real-time data ingestion enables healthcare professionals to monitor patient health and operational metrics in real-time, identify trends and patterns, and implement targeted interventions. With the increasing adoption of digital health technologies and the emphasis on value-based care, the demand for real-time analytics capabilities is expected to continue to rise.


The Humedica Inc invention works as follows
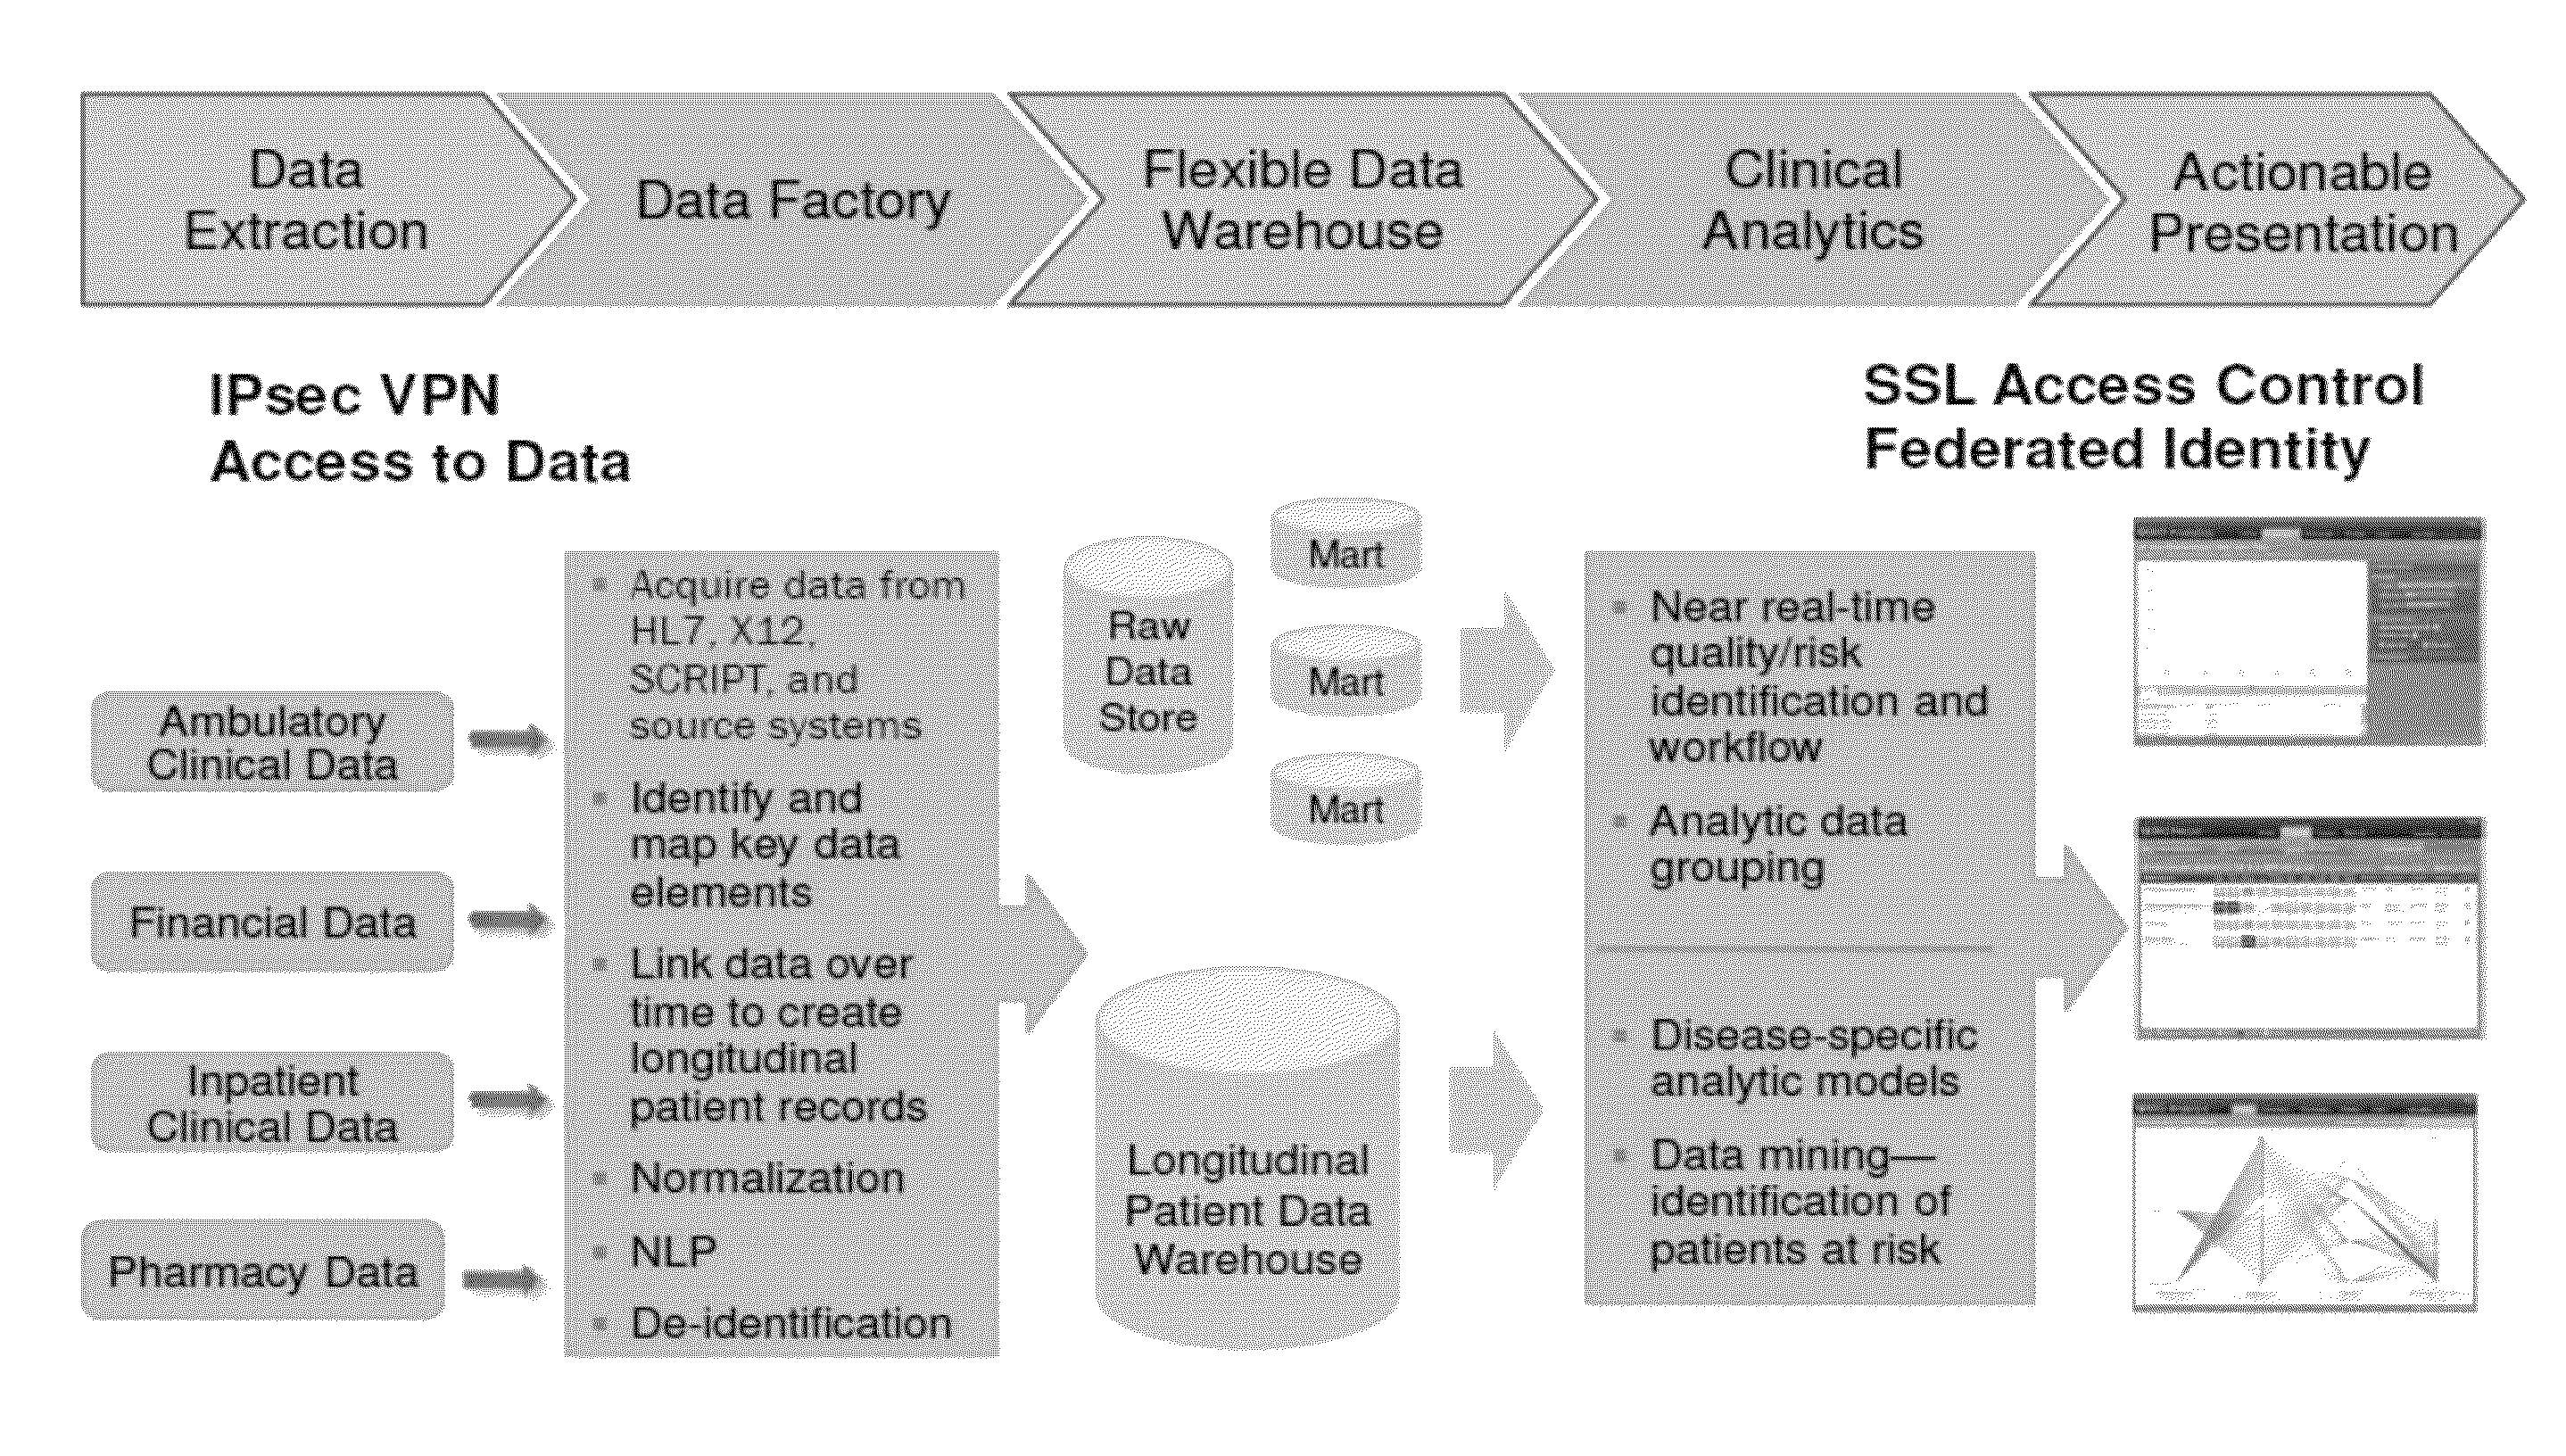
The clinical informatics platform may include a data extraction facility that gathers clinical data from multiple sources, a data mapping facility to identify and map key elements and link the data over time, a normalization facility to normalize the clinical and longitudinal patient information, graphical user interfaces for presenting clinical analytics in an actionable format, and specialized clinical analytics for performing tasks such as benchmarking, quality assurance, and patient tracking. The clinical informatics system may include data extraction facilities that collect clinical data from multiple sources, data mapping facilities that identify and map key data elements, data linking capabilities that link data over time, data normalization tools to normalize and de-identify clinical data, flexible data warehouses for longitudinal patient data storage, clinical analytics for data mining and analytic models building, patient risk assessment, benchmarking, quality assurance and patient tracking and a graphic user interface that presents clinical analytics in a useful format.


Background for Systems and Methods for Real-Time Data Ingestion to a Clinical Analytics Platform to Generate a Heat Map
1. Field
The present invention is related to clinical informatics. It also relates to a platform for clinical informatics and the management of networks of health care providers.
2. “2.
The health care system is evolving at an unprecedented rate. One thing is certain: Knowledge is the key to success during times of uncertainty and change. It is crucial to be able to capture, report and use data in a meaningful way to provide better and cost-effective healthcare. Clinical performance improvement is more important than ever because of value-based purchasing. “Success requires the ability of connecting knowledge with action in order to improve performance.
There is a continuing need for a platform for clinical informatics that can automate the collection, extraction and reporting of certain quality measures. It should also provide real-time clinical monitoring, clinical dashboards and tracking lists for high-priority medical conditions.
The clinical analytics platform automates data capture, extraction and reporting for quality measures. It also provides real-time surveillance, clinical dashboards and tracking lists for high-priority medical conditions.
The invention includes a method for clinical tracking that involves gathering data from multiple sources, processing it, which may include identifying, mapping, and normalizing data elements. This mapping can involve assigning data into a database field according to a hierarchically-organized lexicon of data elements in healthcare, with multiple data element entries being mapped to one field in at least one case, analyzing this data to produce at least one report and presenting the reported in a graphic user interface. A report can identify at least a risk that is relevant to a patient, based in part at least on the healthcare data gathered. The report can include an alert that relates to at least a risk associated with a patient, based in part on healthcare data gathered. This alert may be presented visually or audibly. The report can include an alert that identifies at least one mistake in patient care and at least a recommendation to correct it. The report can include instructions on how one or several healthcare providers should provide care to one patient or more based, at least partially, on the healthcare data gathered. Based at least in part, on the healthcare data gathered, the report could identify a disparity between available resources and patient needs. The report could identify a patient with high healthcare costs based on the collected data. Validating healthcare data elements may also be part of the processing of healthcare data. Data can be collected on a regular basis. The data can be collected in real time, and the report could include instructions on how one or several healthcare providers should provide care for one or multiple patients based in part on the healthcare data gathered. Real-time updates may occur at least every five minutes. The graphical user interface may be presented via a software-as-a-service architecture. The report can relate to a patient, medical care protocol or outcome, demographics, behavioral risk factors, disease risk factors, procedure, therapeutic, therapeutic over a time period, risk level, cost, admission information, utilization, readmission, mortality and complication. The criteria may include a patient’s name, an issue or physician, location, due date for therapy or care, risk level, clinical measure, procedure completed, and image taken.
In an aspect of the invention, a method of optimizing a healthcare resource plan may include gathering healthcare data relating to a plurality of patients from a plurality of sources, wherein the data are gathered on a periodic basis, processing the healthcare data, wherein processing may include identifying, mapping and normalizing healthcare data elements, wherein processing is repeated when new healthcare data may be gathered, wherein the mapping may include assigning data to a field of a database according to a hierarchically organized lexicon of healthcare data elements, wherein multiple data element entries in the lexicon are mapped to a single field for at least one field, analyzing the healthcare data to obtain at least one patient risk identification and patient tracking report, wherein analyzing is repeated when new healthcare data may be gathered and processed, and preparing a healthcare resource plan for care of the plurality of patients and optimizing the healthcare resource plan based on the data contained in the at least one patient risk identification and patient tracking report. The periodic basis may be in real-time. The real-time basis may be at least as frequent as every five minutes. Processing the healthcare data also may include validating the healthcare data elements. The method may further include re-optimizing the healthcare resource plan when new healthcare data may be gathered, processed, and analyzed. The method may further include re-optimizing the healthcare resource plan when a manual change is made to an element of the plan. The tracking report may relate to at least one of a patient, a medical care protocol, an outcome, a demographic, a behavioral risk factor, a disease risk factor, a procedure, a therapeutic, a therapeutic over a given time period, a risk level, a cost, an admission information, a utilization, readmission information, mortality, and a complication. Patients at risk may be automatically detected by the analysis and an alert is generated identifying such patients. High-cost patients may be automatically detected by the analysis and an alert is generated identifying such patients. The healthcare resource plan may be presented in a graphical user interface via a software-as-a-service architecture.
The method may include gathering data from multiple sources, processing it, which may include identifying and mapping healthcare data elements. This may be done by assigning data into a database field according to a hierarchically-organized lexicon of data elements. Multiple data element entries are assigned to one field in the lexicon for atleast one field. Analyzing the healthcare to get atleast one clinical, financial, or operational benchmark. Repeating these steps to get a sample of data that can be compared with the benchmark. The data can be collected on a regular basis. Data can be collected in real time, at least every five minutes. Sources from different geographical regions may be included in the plurality. The plurality may include different healthcare facilities. The plurality may include sources that are specific to a geographic region. Validating healthcare data elements may also be part of the processing of the healthcare data. The method can also include a linking of the healthcare data over time in order to create a longitudinal data recording. The graphical user interface may be presented via a software-as-a-service architecture. At least one of the criteria may be a data provider, time period, chart type, time interval to display, time interval to analyze, filter, hospital, physician, patient, patient characteristic, cohort, disease, gender, age group, treatment, payer type and insurance provider.
The dashboard can include a number of features, such as a clinical informatics system, which includes a data extraction tool that collects data from multiple sources, an analytics model builder, a data normalization tool that normalizes the data, an agile data warehouse that stores raw data and longitudinal patient data and a display definer that works in conjunction with this user-selectable dashboard definer in order to determine the format of the report. Data may be collected on a regular basis. Data can be collected in real time. Real-time data can be collected at least every five minutes. Data normalization may be used to de-identify data. Validating clinical data may be included in the method. The clinical analytics facility can be used to identify patient risks and track patients. The options available may include a benchmark for comparison. Selectable options allow comparisons to another patient, healthcare provider or doctor, healthcare facility or hospital, disease condition, gender, and age group. Selectable options can include the addition a patient tracking and risk identification report that relates to at least one patient, medical care outcome, demographic, behavioral risk factor or disease risk factor. The report format can include a table or chart, text and graph, and it may be customized depending on a data source and time period. It may also be customized by a filter and may take into account a hospital, physician, patient, patient characteristic, cohort, disease, gender, age group, treatment, payer type, and insurance provider. The dashboard may be presented via a software-as-a-service architecture.


The mapping can include assigning multiple data element entries to one field in a database based on a hierarchically-organized lexicon of healthcare elements. Data can be retrieved on a real-time basis. Real-time can be as frequent as five minutes. At least one source of data can be doctor’s notes, from which data can be retrieved by using natural language processing. At least one data sources may include an electronic medical record or electronic health record. Other data sources could be a pharmacy database, doctor’s note, self-reported information, census data and a networked monitoring system. Validating healthcare data elements may also be part of the processing of healthcare data. The at least one of actionable clinical analytics, a patient risk identification, a disease-specific analytic model, a predictive model, a benchmark and a quality measure may be presented in a graphical user interface via a software-as-a-service architecture.
The invention may include, in one aspect, a platform for clinical informatics that includes a data extraction tool that collects data on a regular basis from multiple sources, a mapping facility which identifies key data elements in a database and links them over time. This mapping can include assigning the data to the field in a database based on a hierarchically structured lexicon of data elements in healthcare, wherein at least one field is mapped with multiple data element entries, as well as a normalization facility to the data. Data can be collected on a real-time basis. The real-time data collection may occur at least every five minutes. Doctor’s notes may be one of the many sources from which data can be retrieved by using natural language processing. These sources can include an electronic medical record or electronic health record. They may also include pharmacy data. The data normalization facility can de-identify data. Validating clinical data may be included in the method. The graphical user interface may be presented via a software-as-a-service architecture.
The invention also includes a computer-readable medium with code that implements a method of describing, evaluating or understanding a network health care provider. This method can include creating a referral database of physicians or health care professionals from at least one private or public data source; extracting information pertaining to patients or referrals shared between physicians and providers of health care from the database; and generating a graphic representation of referral patterns within the referral networks of physicians or health care practitioners, wherein one or more elements of the graphic representation represent a measure of a type of an activity in the network. A type of activity can be represented by an element of the graphic representation using at least one of color, size, pattern, and thickness. The element of a graphical representation can show how many patients are shared between at least two providers of health care. The medium can also include analyzing referral patterns within the graphical representation in order to analyze characteristics of the network’s practice and enable management of the health care provider network. Data mining techniques may be used to identify relationship data between physicians, health care providers and other referral networks. In the step of building a network of referrals between physicians and healthcare providers, physicians and care providers can be identified as nodes in a network with links. Data sources can include both automated data collection and user generated data for referral network building. User-generated data can be from a survey. Data relating to shared patients or referrals can be extracted from an electronic health record or claims database. The graphical display can be an xyz system, a radar map, a pie graph, or another non-xy plot. In the graphical representation, groups of physicians and healthcare providers can be distinguished by at least one color, shape, shading or size. The size of an object that represents physicians or health-care providers in a graphic representation can be correlated with a metric. The metric can be cost, compliance, quality, or any other measure of medical treatment, cost, resource usage, quality, or patient outcome.
The following detailed description and drawings of the preferred embodiment will reveal to those with knowledge of the art that the invention includes other objects, methods, features and advantages.
All documents referenced herein are hereby included in their entirety. If the text does not state otherwise, or it is clear, all references to items in the singular must be understood to include items from the plural. Grammatical conjunctions can express all disjunctive or conjunctive combinations, sentences, words, and other conjoined clauses.
The clinical analytics platform automates data capture, extraction and reporting for quality measures. It also provides real-time surveillance, clinical dashboards and tracking lists for high-priority health conditions. Real-time is used throughout this specification to indicate that an action was taken within a certain time interval, so that the platform 100 has data which are current at a time interval not too far away from the current time. The interval may vary from several hours to minutes (such as five minutes) or even instantaneous.
The clinical informatics platform can provide insight to health care providers, pharmaceutical and biotechnology companies, medical device manufacturers and government agencies on how to manage provider networks, shared referrals or patients, how patient populations and treatments are treated and which procedures and treatments are prescribed. It also provides information about the cost, quality and efficacy of care. The clinical informatics system can assemble, standardize and analyze data from various treatment settings, time periods, social networks, referrals, insurance, and financial sources to create a comprehensive, longitudinal view of patient care. By combining powerful real-time prediction tools with deep, retrospective capabilities, the clinical informatics platforms can address the needs of outpatient and inpatient health care providers as well as pharmaceutical and biotechnology companies, medical device makers, government agencies and financial services firms.
The clinical informatics platform may enable organizations to transform an immense reservoir of data into valuable, actionable knowledge using a comprehensive suite of software-as-a-service (SaaS) solutions that unlock the clinical information needed to improve patient care while improving financial performance. The SaaS clinical informatics platform uses sophisticated techniques to mine and standardize health care data across disparate IT systems. This is done in a highly secure, HIPAA compliant and state-of-the art environment. The clinical informatics platforms analyzes clinical, financial, insurance, referral and social network data. It then delivers powerful insights and benchmarks using real-time, retrospective and cost-effective SaaS tools. SaaS tools allow for real-time comparative analytics to be delivered without requiring the end user to maintain or purchase additional hardware. They also include rapid, scalable data extraction, mapping and ontological standardization systems. The clinical informatics platforms may combine retrospective, in-depth analytic systems such as the benchmarking tool 202 and the clinical surveillance tool 302 with real-time processing capabilities. The platform can be modular in some embodiments and may contain all tools available or just certain tools. The clinical informatics platforms may include modules, disease-specific analytical tools, and predictive models. The clinical informatics platforms may enable or include detailed, customizable benchmarks for clinical, financial, social network and referral data, as well as operational, financial, insurance, and social network benchmarks. The clinical informatics platforms may facilitate the development and testing of operational and performance improvement strategies in and between organizations.
The historical barriers to leveraging data from health care, referrals, insurance, and social networks are many. Data reside in different systems. Data are trapped in free text and local terminologies. Robust clinical models require expensive tools and large sample sizes. Real-time clinical analytics is costly and difficult to use. The need is clear: to extract all data, normalize the data and provide robust clinical analytics and networking analysis, as well as deliver powerful and timely insight. The clinical analytics platform is able to meet these needs. It has flexible platform-agnostic capabilities for data extraction, scalable data standardization, next-generation NLP, a relational longitudinal data warehouse, real time predictive analytics, modeling tools, patient tracking, social networking, referral analysis, and clinical check-lists. The clinical informatics platforms allows users to gain insight into an organization’s clinical and operational performance, benchmark performance, conduct real-time analytics, and perform retrospective analyses. They can also use disease-specific analytics to intervene quickly to identify at-risk patients, reduce mortality and morbidity in real-time.
An understanding of all aspects of clinical and operational performance, such as the quality, safety, and cost of healthcare provider care, may be enabled by the clinical informatics platform. The health care provider may be enabled to act in real-time to ensure delivery of the best and most efficient care. Health care providers may be enabled to compare, analyze, and identify best practices, and then collaborate with peers around the development and dissemination of best practices and to optimize performance-based reimbursement. The clinical informatics platform may connect cost and outcomes to maximize cost-effective care, identify and track the care of high-cost and high-risk patients in real-time to reduce preventable complications and/or never events, and improve performance on Joint Commission (JCAHO) and pay-for-performance measures, and prove the value of the care delivered to payers with customizable, comparative performance benchmarks. Health care providers may be empowered to qualify for certain government and private programs, such as the American Recovery and Reinvestment Act (ARRA) funding.


Referring to FIG. A block diagram for the clinical analytics platform is shown in Figure 1a. A data extraction facility can extract data from disparate healthcare and claims data source 118, allowing for real-time data collection, processing, and central storage of health records. Data ingestion techniques can be applied to heterogeneous systems of EMRs of various vendors to collect data, normalize it and then store it in a homogenous data base where one set of applications is used to interact with the data and analyze it. Data ingestion can be real-time and continuous. 118 This may include data from ambulatory clinical systems, pharmacy systems, doctor’s records, EHRs, EMRs inpatient clinical systems, biographical information, hospital billing, claims, census, self-reported, networked monitors, etc. blood pressure device, glucose meter, etc. (Mortality data, telemetry systems, clinical guidelines management systems, order sets and so on. NLP techniques, for example, can be used in order to collect data from transcriptions or doctor’s notes. The data can be extracted and optionally encrypted before being ingested into the system as part of a running loading process. RSS feeds or transmissions or extractions of data can be used to obtain data. Formats include HL7v2, HL7v3, Dicom X12N NCPDP X12N SCRIPT X12 CSV HL7v2 HL7v3 HL7v3 HL7v3 HL7v3 HL7v3 HL7v3 HL7v2 HL7v3 HL7v3 HL7v3 HL7v3 HL7v3, HL7v3, HL7v3, HL7v3, HL7v3, HL7v3, HL7v3 HL7v3, HL7v3, HL7v3, HL7v3, HL7v2, HL7v2, HL7v2 HL7v2, HL7v2, HL7v2, HL7v2, HL7v2, HL7v2 v2 v2 v2, HL7v2 v2 v2 v2, HL7v2, ETL tools can be used to connect to remote databases and to pull data from the remote databases. This method is faster and uses less hardware because a copy of data doesn’t have to be created for transmission or extraction.


Click here to view the patent on Google Patents.